Marfeel is built upon a powerful data reporting infrastructure. The Marfeel Reporting API provides programmatic methods to access report data from Marfeel Explore. With the Marfeel Reporting API you can:
- Build custom dashboards to display Marfeel data.
- Automate complex reporting tasks to save time.
- Integrate your Marfeel data with other business applications.
- Create recirculation modules although we would recommend you to use no-code Marfeel Experiences for this.
This document is a developer guide to the Marfeel Reporting API.
To use the Marfeel Reporting API to request data, you must construct a Request object which requires this structure:
{
    "dates": {
        "last": {
            "number": 30,
            "dimension": "minute"
        }
    },
    "filters": [
    ],
    "groupBy": [
    ],
    "metrics": [
        "uniqueUsers"
    ],
    "order": {
        "metric": "uniqueUsers",
        "sort": "DESC"
    },
    "granularity": "realtime",
    "limit": 100,
    "from": 0
}
The Reporting API endpoint is https://api.newsroom.bi/api/dashboard/query
Metrics
Metrics are quantitative measurements; every request requires at least one metric. You can request multiple metrics from the metrics available.
Get the number of unique users
In the following example the uniqueUsers metric is supplied to the metrics object.
curl --location --request POST 'https://api.newsroom.bi/api/dashboard/query' \
-H 'Content-Type: application/json' \
-H 'Authorization: Bearer eyJh...' \
--data-raw '{
    "dates": {
        "last": {
            "number": 30,
            "dimension": "minute"
        }
    },
    "granularity": "realtime",
    "filters": [
    ],
    "groupBy": [
    ],
    "metrics": [
        "uniqueUsers"
    ],
    "order": {
        "metric": "uniqueUsers",
        "sort": "DESC"
    },

    "limit": 100,
    "from": 0
}'
The response body indicates the total number of uniqueUsers is "total":10. As "granularity": "realtime" has been requested. The Response also includes "data" buckets of 5 min each with the uniqueUsers metric.
[
  {
    "metric": "uniqueUsers",
    "total": 10,
    "granularity": "realtime",
    "availableGranularities": [
      "realtime",
      "hourly",
      "daily"
    ],
    "actualData": {
      "values": [
        {
          "key": "cfab1ba8c67c7c838db98d666f02a132",
          "total": 10,
          "items": [
            {
              "id": "--",
              "value": "--",
              "type": "metric"
            }
          ]
        }
      ],
      "data": [
        {
          "cfab1ba8c67c7c838db98d666f02a132": 5,
          "label": "2022-03-26 07:25"
        },
        {
          "cfab1ba8c67c7c838db98d666f02a132": 4,
          "label": "2022-03-26 07:30"
        },
        {
          "cfab1ba8c67c7c838db98d666f02a132": 2,
          "label": "2022-03-26 07:35"
        },
        {
          "cfab1ba8c67c7c838db98d666f02a132": 2,
          "label": "2022-03-26 07:40"
        },
        {
          "cfab1ba8c67c7c838db98d666f02a132": 3,
          "label": "2022-03-26 07:45"
        }
      ]
    },
    "compareData": null
  }
]
Get the number of unique users, page views and revenue
In the following example the "uniqueUsers", "pageViewsTotal", "revenueTotal" metrics are requested.
curl --location --request POST 'https://api.newsroom.bi/api/dashboard/query' \
-H 'Content-Type: application/json' \
-H 'Authorization: Bearer eyJh...' \
--data-raw '{
    "dates": {
        "last": {
            "number": 30,
            "dimension": "minute"
        }
    },
    "granularity": "realtime",
    "filters": [
    ],
    "groupBy": [
    ],
    "metrics": [
        "uniqueUsers", "pageViewsTotal", "revenueTotal"
    ],
    "order": {
        "metric": "uniqueUsers",
        "sort": "DESC"
    },

    "limit": 100,
    "from": 0
}'
The response body returns an array of metric results, one per requested metric.
[
  {
    "metric": "uniqueUsers",
    ...
  }, {
    "metric": "pageViewsTotal",
    ...
  }, {
    "metric": "revenueTotal",
    ...
  }
Dimensions
Dimensions describe characteristics of your users, their sessions, and actions with regards to your content. Visitor Loyalty, for example, describes user engagement and indicates their loyalty (“New”, “Fly by”, “Casual”, “Won back”, “Loyal” or “Lover”). In a request you can specify zero or more dimensions from the ones available.
Get the urls with the most users during the previous day
curl --location --request POST 'https://api.newsroom.bi/api/dashboard/query' \
-H 'Content-Type: application/json' \
-H 'Authorization: Bearer eyJh...' \
--data-raw '{
    "dates": {
        "last": {
            "number": 1,
            "dimension": "day"
        }
    },
    "granularity": "daily",
    "filters": [
    ],
    "groupBy": [
        "url"
    ],
    "metrics": [
        "uniqueUsers"
    ],
    "order": {
        "metric": "uniqueUsers",
        "sort": "DESC"
    },

    "limit": 100,
    "from": 0
}'
Get the number of unique users by Visitor Loyalty
In the following example the visitorFrequency dimension is used.
curl --location --request POST 'https://api.newsroom.bi/api/dashboard/query' \
-H 'Content-Type: application/json' \
-H 'Authorization: Bearer eyJh...' \
--data-raw '{
    "dates": {
        "last": {
            "number": 1,
            "dimension": "day"
        }
    },
    "granularity": "daily",
    "filters": [],
    "groupBy": [
        "visitorFrequency"
    ],
    "metrics": [
        "uniqueUsers"
    ],
    "order": {
        "metric": "uniqueUsers",
        "sort": "DESC"
    },

    "limit": 100,
    "from": 0
}'
Response object
[
  {
    "metric": "uniqueUsers",
    "total": 919,
    "granularity": "daily",
    "availableGranularities": [
      "realtime",
      "hourly",
      "daily"
    ],
    "actualData": {
      "values": [
        {
          "key": "cfcd208495d565ef66e7dff9f98764da",
          "total": 875,
          "items": [
            {
              "id": "0",
              "value": "New",
              "type": "visitorFrequency"
            }
          ]
        },
        {
          "key": "c81e728d9d4c2f636f067f89cc14862c",
          "total": 95,
          "items": [
            {
              "id": "2",
              "value": "Fly by",
              "type": "visitorFrequency"
            }
          ]
        },
        {
          "key": "eccbc87e4b5ce2fe28308fd9f2a7baf3",
          "total": 15,
          "items": [
            {
              "id": "3",
              "value": "Casual",
              "type": "visitorFrequency"
            }
          ]
        },
        {
          "key": "c4ca4238a0b923820dcc509a6f75849b",
          "total": 5,
          "items": [
            {
              "id": "1",
              "value": "Won back",
              "type": "visitorFrequency"
            }
          ]
        },
        {
          "key": "a87ff679a2f3e71d9181a67b7542122c",
          "total": 3,
          "items": [
            {
              "id": "4",
              "value": "Loyal",
              "type": "visitorFrequency"
            }
          ]
        },
        {
          "key": "e4da3b7fbbce2345d7772b0674a318d5",
          "total": 2,
          "items": [
            {
              "id": "5",
              "value": "Lover",
              "type": "visitorFrequency"
            }
          ]
        }
      ],
      "data": [
        {
          "cfcd208495d565ef66e7dff9f98764da": 593,
          "c81e728d9d4c2f636f067f89cc14862c": 73,
          "eccbc87e4b5ce2fe28308fd9f2a7baf3": 14,
          "c4ca4238a0b923820dcc509a6f75849b": 4,
          "a87ff679a2f3e71d9181a67b7542122c": 3,
          "e4da3b7fbbce2345d7772b0674a318d5": 2,
          "label": "2022-03-25 00:00"
        },
        {
          "cfcd208495d565ef66e7dff9f98764da": 282,
          "c81e728d9d4c2f636f067f89cc14862c": 25,
          "eccbc87e4b5ce2fe28308fd9f2a7baf3": 2,
          "c4ca4238a0b923820dcc509a6f75849b": 1,
          "a87ff679a2f3e71d9181a67b7542122c": 0,
          "e4da3b7fbbce2345d7772b0674a318d5": 0,
          "label": "2022-03-26 00:00"
        }
      ]
    },
    "compareData": null
  }
]
Filtering
When submitting a request, you can ask it to return only metrics that meet specific criteria. To filter metrics, in the request body, specify one or more filter object. In each filter specify the values for the following:
filter: represents the dimension you are going to filter by.oprepresents theoperatorvalueis an array of values to filter by. If you provide multiple values it’s considered anORoperation.
Add as many filters as you want. The filters are executed with an AND operation.
Then the filter works as follows:
if  {filter} {op} {value}
    return the row
There are 6 available operations op:
eq: equalneq: not equallike: containsnlike: not containsgt: grater thanlt: lower than
Get the urls with the most loyal and lover users during the previous day
curl --location --request POST 'https://api.newsroom.bi/api/dashboard/query' \
-H 'Content-Type: application/json' \
-H 'Authorization: Bearer eyJh...' \
--data-raw '{
    "dates": {
        "last": {
            "number": 1,
            "dimension": "day"
        }
    },
    "granularity": "daily",
    "filters": [{
        "filter": "visitorFrequency",
        "op": "eq",
        "value": [5, 4]
    }],
    "groupBy": [
        "url"
    ],
    "metrics": [
        "uniqueUsers"
    ],
    "order": {
        "metric": "uniqueUsers",
        "sort": "DESC"
    },

    "limit": 100,
    "from": 0
}'
Get the urls with the most users from Google Discover
curl --location --request POST 'https://api.newsroom.bi/api/dashboard/query' \
-H 'Content-Type: application/json' \
-H 'Authorization: Bearer eyJh...' \
--data-raw '{
    "dates": {
        "last": {
            "number": 1,
            "dimension": "day"
        }
    },
    "granularity": "daily",
    "filters": [{
        "filter": "source",
        "op": "eq",
        "value": ["Google Discover"]
    }],
    "groupBy": [
        "url"
    ],
    "metrics": [
        "uniqueUsers"
    ],
    "order": {
        "metric": "uniqueUsers",
        "sort": "DESC"
    },

    "limit": 100,
    "from": 0
}'
Get the urls or articles in section 3674 that acquired the most users from Google Discover
curl --location --request POST 'https://api.newsroom.bi/api/dashboard/query' \
-H 'Content-Type: application/json' \
-H 'Authorization: Bearer eyJh...' \
--data-raw '{
    "dates": {
        "last": {
            "number": 1,
            "dimension": "day"
        }
    },
    "granularity": "daily",
    "filters": [{
        "filter": "source",
        "op": "eq",
        "value": ["Google Discover"]
    },{
        "filter":"section",
        "op":"eq",
        "value":[3674]
    }],
    "groupBy": [
        "url"
    ],
    "metrics": [
        "uniqueUsers"
    ],
    "order": {
        "metric": "uniqueUsers",
        "sort": "DESC"
    },

    "limit": 100,
    "from": 0
}'
Ordering
To sort the results by a metric value:
- Supply its name
- Specify the sort order (
ASCorDESC)
Date Ranges
The Marfeel Reporting API allows you to get data specifying a data range or a relative period of time using the last operator.
Get the unique users of February
curl --location --request POST 'https://api.newsroom.bi/api/dashboard/query' \
-H 'Content-Type: application/json' \
-H 'Authorization: Bearer eyJh...' \
--data-raw '{
    "dates": {
        "range": {
            "start": "2021-02-01",
            "end": "2021-02-28"
        }
    },
    "granularity": "daily",
    "filters": [],
    "groupBy": [
    ],
    "metrics": [
        "uniqueUsers"
    ],
    "order": {
        "metric": "uniqueUsers",
        "sort": "DESC"
    },

    "limit": 100,
    "from": 0
}'
Get the unique users of the last 7 days
curl --location --request POST 'https://api.newsroom.bi/api/dashboard/query' \
-H 'Content-Type: application/json' \
-H 'Authorization: Bearer eyJh...' \
--data-raw '{
    "dates": {
        "last": {
            "number": 7,
            "dimension": "day"
        }
    },
    "granularity": "daily",
    "filters": [],
    "groupBy": [
    ],
    "metrics": [
        "uniqueUsers"
    ],
    "order": {
        "metric": "uniqueUsers",
        "sort": "DESC"
    },

    "limit": 100,
    "from": 0
}'
Granularity
The Marfeel Reporting API allows you to get data with different granularity. You can request realtime, hourly, daily, weekly or monthly granularity. You can find a detailed explanation here about granularity.
Pagination
The Marfeel Reporting API uses the limit and from fields to paginate through response results that span multiple pages. The max length of limit being 500.
Get the first 10 urls with the most traffic during the last 30 days
curl --location --request POST 'https://api.newsroom.bi/api/dashboard/query' \
-H 'Content-Type: application/json' \
-H 'Authorization: Bearer eyJh...' \
--data-raw '{
    "dates": {
        "last": {
            "number": 30,
            "dimension": "day"
        }
    },
    "granularity": "monthly",
    "filters": [
    ],
    "groupBy": [
        "url"
    ],
    "metrics": [
        "uniqueUsers"
    ],
    "order": {
        "metric": "uniqueUsers",
        "sort": "DESC"
    },

    "limit": 10,
    "from": 0
}'
Get the second page of urls (urls 10 to 20) with the most traffic during the last 30 days
curl --location --request POST 'https://api.newsroom.bi/api/dashboard/query' \
-H 'Content-Type: application/json' \
-H 'Authorization: Bearer eyJh...' \
--data-raw '{
    "dates": {
        "last": {
            "number": 30,
            "dimension": "day"
        }
    },
    "granularity": "monthly",
    "filters": [
    ],
    "groupBy": [
        "url"
    ],
    "metrics": [
        "uniqueUsers"
    ],
    "order": {
        "metric": "uniqueUsers",
        "sort": "DESC"
    },

    "limit": 10,
    "from": 10
}'
Examples
Here are some more queries you might find useful as a reference:
List of the articles with the most traffic from social during the the last 7 days
curl --location --request POST 'https://api.newsroom.bi/api/dashboard/query' \
-H 'Authorization: Bearer eyJh...' \
--header 'Content-Type: application/json' \
--data-raw '{
    "dates":{
        "last":{
            "number":"7",
            "dimension":"day"
        }
    },
    "filters":[{
        "filter":"mediumInternal",
        "op":"eq",
        "value":["social"]
    }],
    "groupBy":[
        "url"
    ],
    "metrics":[
        "uniqueUsers"
    ],
    "order":{
        "metric":"uniqueUsers",
        "sort":"DESC"
    },
    "granularity":"daily"
}'
Which articles had more PV from paying users on march the 17th?
curl --location --request POST 'https://api.newsroom.bi/api/dashboard/query' \
-H 'Authorization: Bearer eyJh...' \
--header 'Content-Type: application/json' \
--data-raw '{
    "dates":{
        "groupedBy":"daily",
        "range":{
            "end":"2022-03-17",
            "start":"2022-03-17"
        }
    },
    "filters":[{
        "filter":"userType",
        "op":"eq",
        "value":[3]
    }],
    "groupBy":[
        "url"
    ],
    "metrics":[
        "uniqueUsers"
    ],
    "order":{
        "metric":"uniqueUsers",
        "sort":"DESC"
    },
    "granularity":"daily"}'
}'
How many articles where published in each section on march the 17th and how many PV did they generate?
curl --location --request POST 'https://api.newsroom.bi/api/dashboard/query' \
-H 'Authorization: Bearer eyJh...' \
--header 'Content-Type: application/json' \
--data-raw '{
    "dates":{
        "groupedBy":"daily",
        "range":{
            "end":"2022-03-17",
            "start":"2022-03-17"
        }
    },
    "filters":[{
        "filter":"publishDate",
        "op":"eq",
        "value":["2022-03-17"]
    }],
    "groupBy":[
        "section"
    ],
    "metrics":[
        "newArticles", "pageViewsTotal"
    ],
    "order":{
        "metric":"pageViewsTotal",
        "sort":"DESC"
    },
    "granularity":"daily"
}'
What are the top 50 articles based on internal traffic in a 10-minute-long period
curl --location --request POST 'https://api.newsroom.bi/api/dashboard/query' \
-H 'Authorization: Bearer eyJh...' \
--header 'Content-Type: application/json' \
--data-raw '{
    "dates":{
        "groupedBy":"daily",
        "range":{
            "end":"2022-03-17 12:10:00",
            "start":"2022-03-17 12:00:00"
        }
    },
    "filters":[{
        "filter":"mediumInternal",
        "op":"eq",
        "value":["internal"]
    }],
    "groupBy":[
        "url","title"
    ],
    "metrics":[
        "uniqueUsers"
    ],
    "order":{
        "metric":"uniqueUsers",
        "sort":"DESC"
    },
    "granularity":"daily",
    "limit":50,
    "from":0
}'
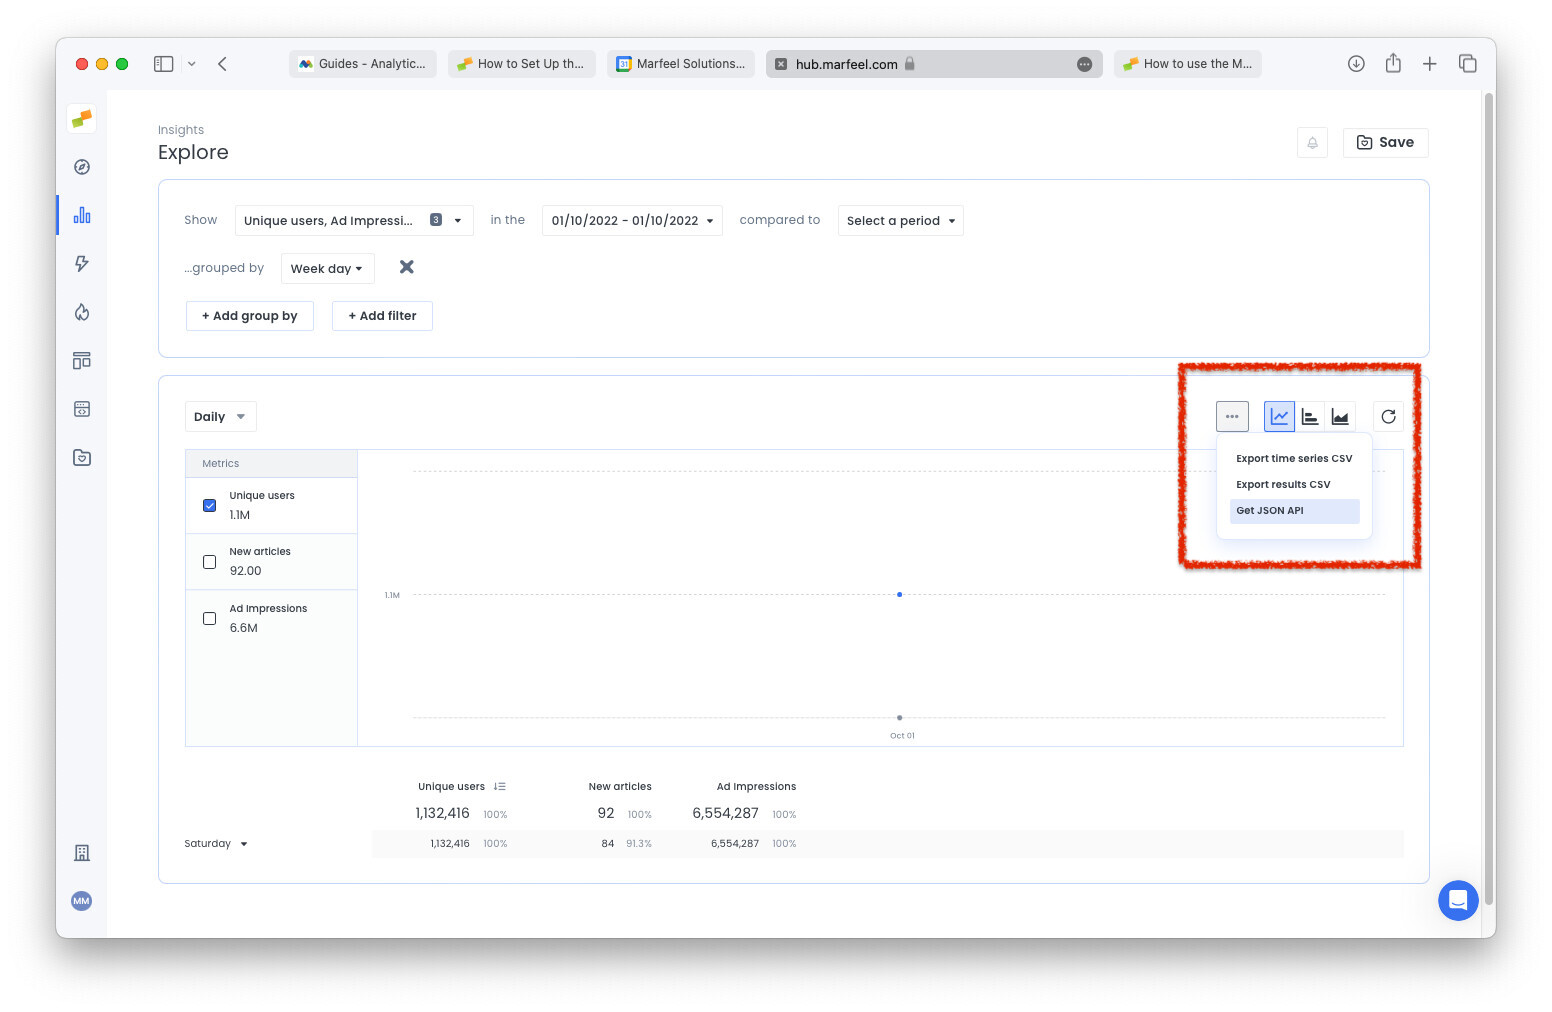
Building sophisticated queries
Most of the queries you will build can be potentially built with in the Marfeel Explore view. The UI uses the Marfeel Reporting API under the hood and can be used as a helper tool for your advanced queries using one of these two mechanisms:
- Use the
Get JSON APIoption on Explore to copy the body request of the query you build
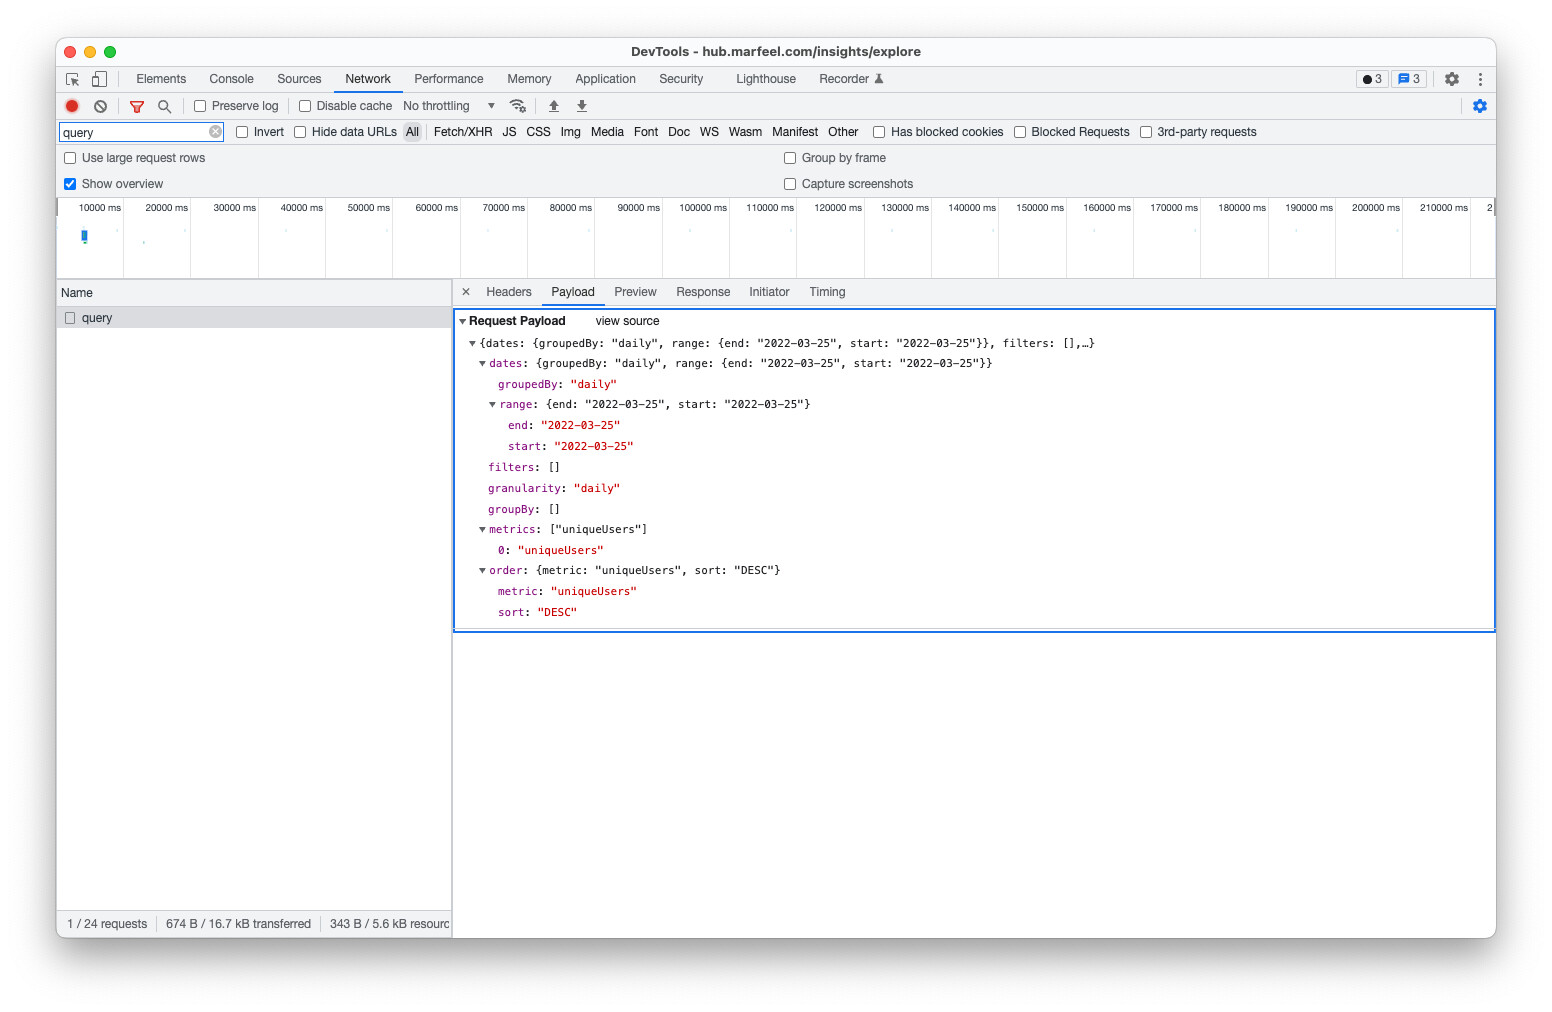
- You can use the Network panel of the Browser Developer Tools to inspect requests to
https://api.newsroom.bi/api/dashboard/query. You can get the request object and provide it directly to--data-raw:
Troubleshooting
Curl ends with error: upstream request timeout
Validate your curl request as it could have an invalid character at the end of the line like ...,"sort":"DESC"},"granularity":"hourly"}' \ > /Documents/data.txt
and it should be ...,"sort":"DESC"},"granularity":"hourly"}' > /Documents/data.txt