
Pivot Tables in Explore: Analyze Your Data in New Ways
You can now use pivot tables in Explore to view your data from multiple angles at once. Select a secondary dimension (like device type or country) and your report will automatically reorganize to show comparisons across those categories. This makes it easier to spot patterns and compare performance across different segments without creating multiple reports.
Pivot Tables in Explore: Analyze Your Data from Multiple Angles
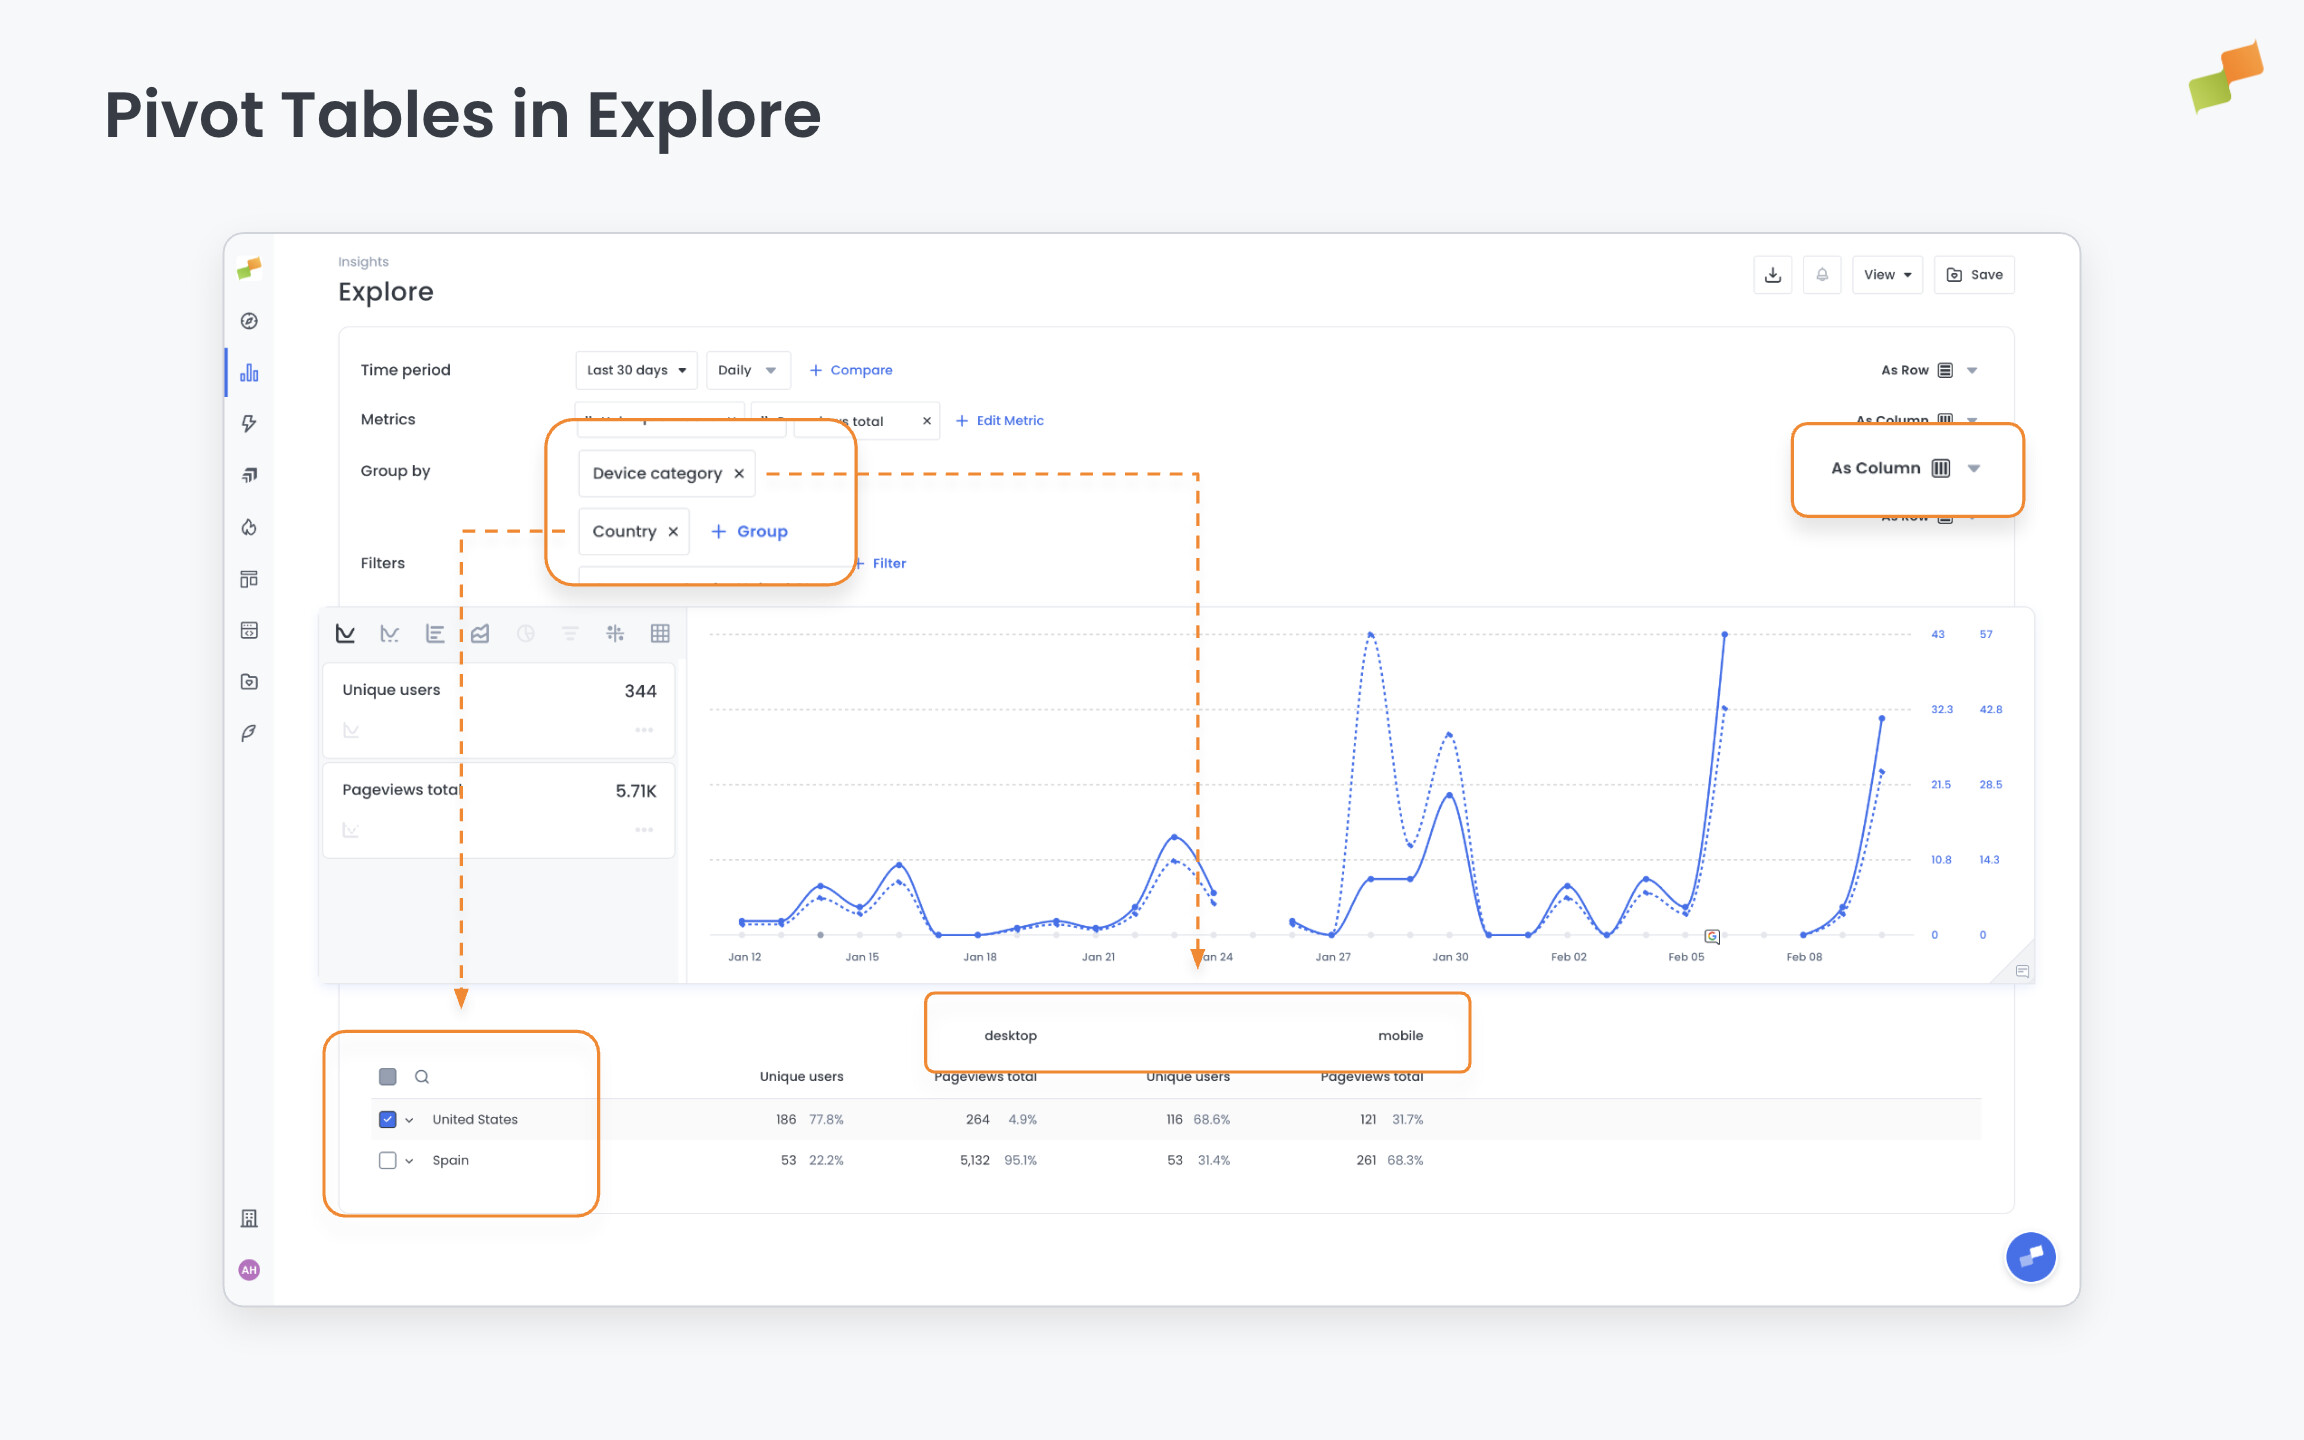
Section titled “Pivot Tables in Explore: Analyze Your Data from Multiple Angles”Explore now supports pivot tables, a powerful way to analyze your data across two dimensions simultaneously. This feature transforms how you can examine patterns, compare performance, and uncover insights without creating multiple reports.
When you select a pivot dimension (such as device type, country, or content category), Explore automatically reorganizes your data to show each value as a separate column. This makes side-by-side comparisons immediate and intuitive. For example, you can now see how articles perform across different traffic sources in a single view, or compare ecommerce metrics broken down by both product category and device type.
What You Can Do
Section titled “What You Can Do”- Add pivot dimensions to any report: Select a secondary grouping to transform your data into pivot table format
- Compare across categories: View metrics for up to 10 different values of your pivot dimension in one table
- Work with all data types: Use pivot mode across articles, multimedia, ecommerce, social, conversions, and monitoring reports
Real-World Use Cases
Section titled “Real-World Use Cases”- Content performance analysis: Group articles by author and pivot by traffic source to see which authors perform best on different channels
- Audience segmentation: Analyze engagement metrics by content category, pivoted by device type or geography
- Ecommerce optimization: Track product performance by category, pivoted by conversion funnel stage
- Social media strategy: Compare content distribution across social platforms, pivoted by post type or timing
This feature responds to requests for more flexible data exploration without the complexity of exporting to spreadsheets. Pivot mode is available now in Explore for all report types, making sophisticated multi-dimensional analysis accessible directly in your workflow.