
Multimedia analytics overview for video and podcasts
Marfeel Multimedia Analytics lets you measure exactly how your video and podcast content performs — from real-time concurrent viewers to full conversion funnels and ad inventory sizing. Use it to understand what resonates with users, drives engagement, and contributes to monetization goals.
With this add-on, you can make data-driven decisions on your multimedia strategy, such as determining what stories that don’t have multimedia content deserve to have a video made specifically for them to boost their engagement.
Using Multimedia
Section titled “Using Multimedia”If an article contains a video or a podcast, you can recognize it from the play button or the podcast icon in the Compass dashboard.
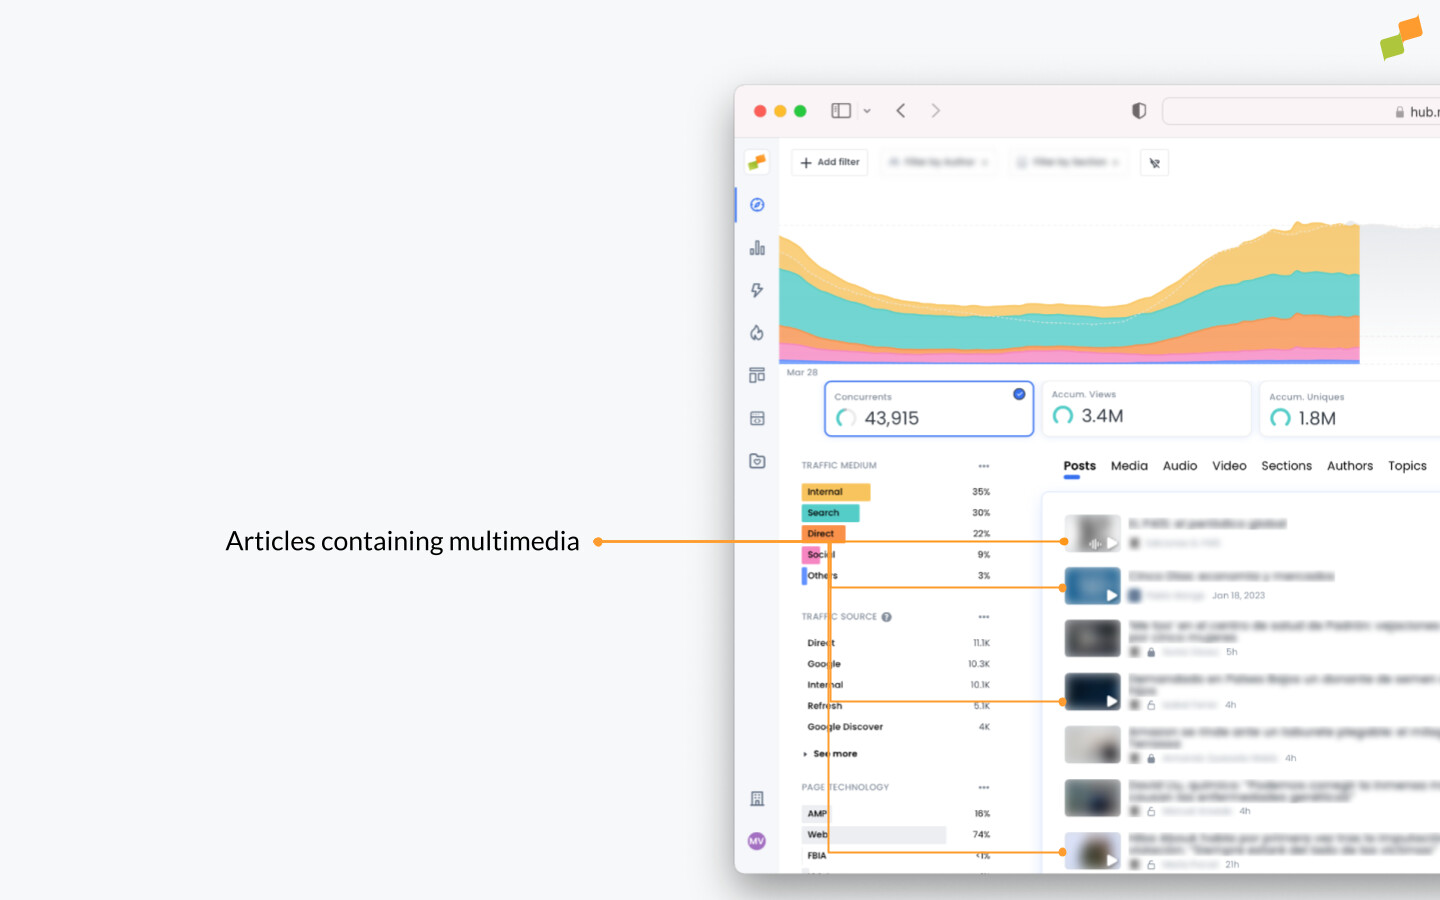
When you click on the Media tab, all listed media elements become visible. Clicking on a video or podcast allows you to go deeper into the metrics and track the whole funnel — from load to completion. For example: analyze how often ads start playing in a video for monetization purposes, or how many users have completed watching the video to check if the content is relevant enough. This can be done in real time, but also by going back in time.
Adopt the following flow to analyze your media content:
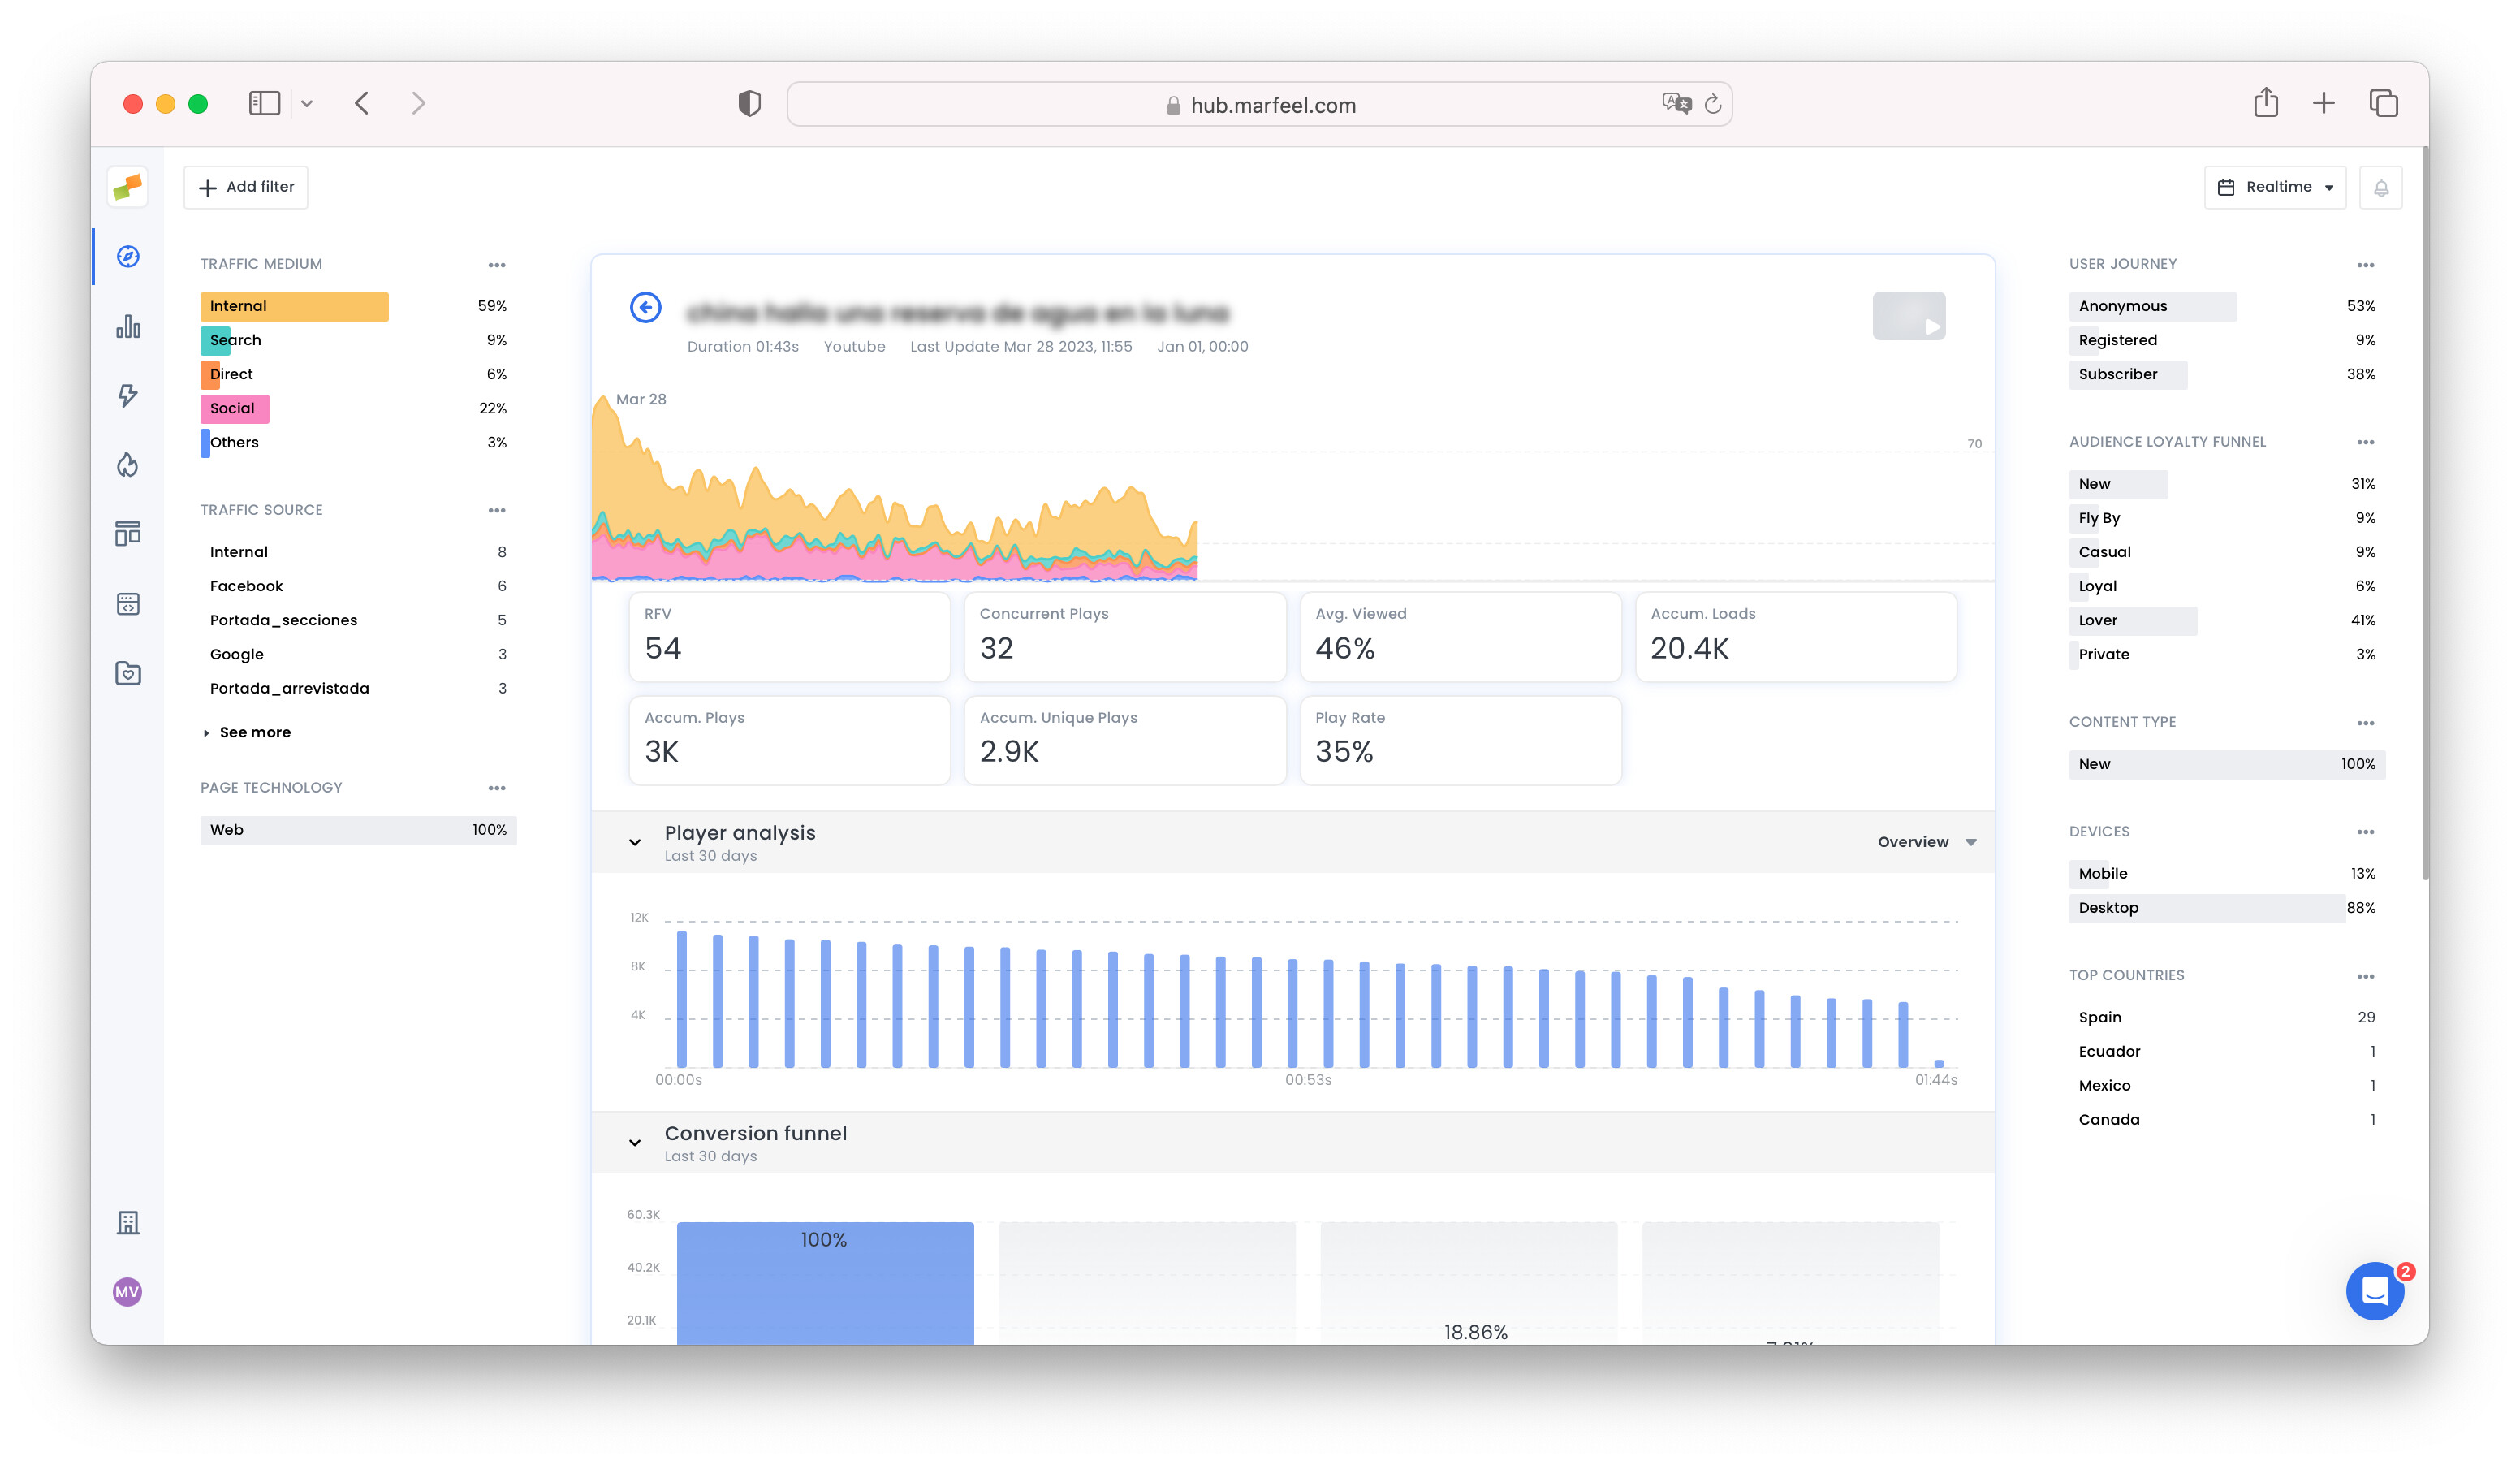
- How many users are currently watching the video? You can immediately see this when opening the media item on the graph that shows real-time concurrents. This metric helps you understand how many users are digesting your video right now.
- How is my media performing? For a quick overview, check the Main KPIs right under the real-time graph to see accumulated loads versus accumulated plays. This way, you can monitor if users are hitting the play button.
- Measure video engagement: Scrolling further down, the
Player analysisshows you at what point users paused the video, or when users dropped out — making it measurable when viewers stopped engaging. Select more actions from the dropdown menu by clicking on Overview. - How often is my media played? The
Conversion funneltab shows how many times the video was loaded, if users pressed the start button, if the ad started playing, and if they completed watching the full media file. This tells you how much of your video is being actively watched. - Identify optimization opportunities: With
Video insightsyou can see unique viewers, minutes viewed, audience retention, and average and total ads played — valuable for monetization purposes. If users are not getting past the ad, it might be because the ad and video content are incompatible. - Articles where the video appears: The last tab shows you in which articles the video and/or podcast have been reproduced.
- Track live and on-demand data: The main metrics allow you to view accumulated plays and unique plays, but also live plays. The latter can be viewed from the detailed view, but also by clicking on
Concurrent playsin the main Multimedia dashboard, which shows how many users are viewing each piece of multimedia content in real time.
User types
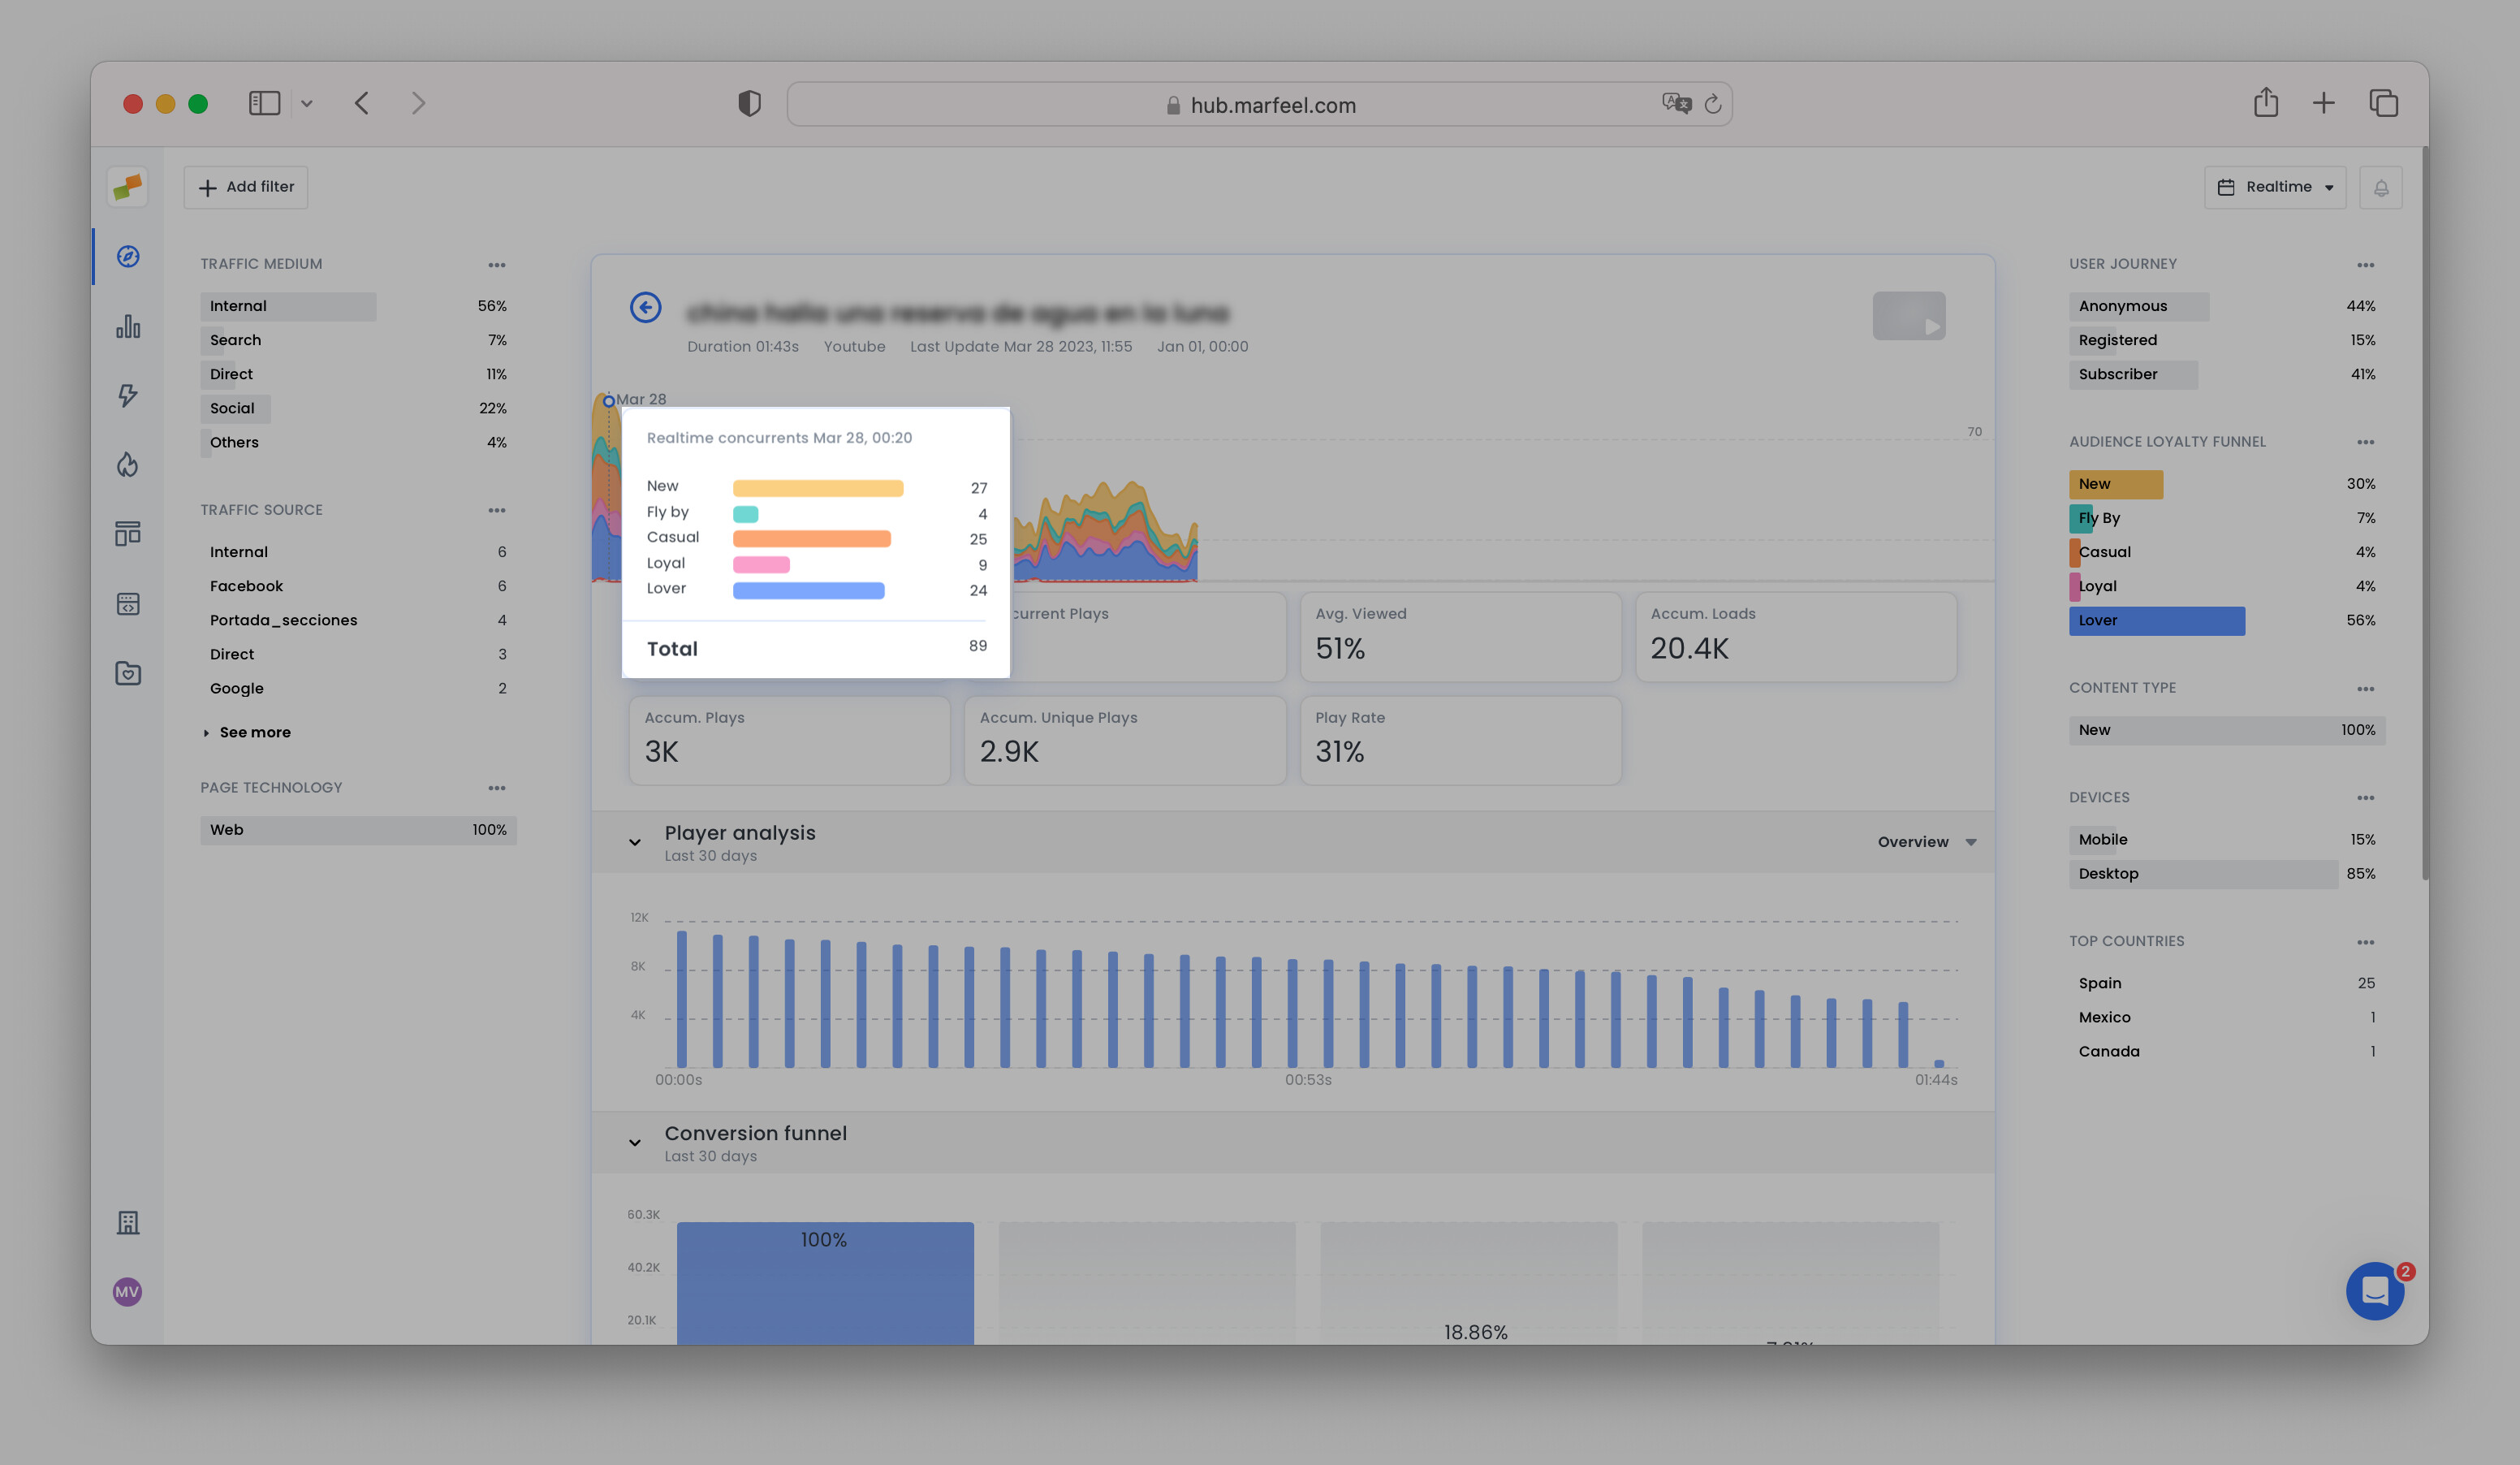
Section titled “User types”You can segment multimedia viewers by loyalty level to understand whether your content attracts top-of-funnel or bottom-of-funnel audiences. Click on the three dots next to Audience Loyalty Funnel → plot to main graph. Split the concurrents on the type of user. In the example below you can see clearly that the video is popular with New users, Casual users, and Lovers, which helps you make editorial decisions based on these outcomes.
Detailed metrics & ad inventory sizing
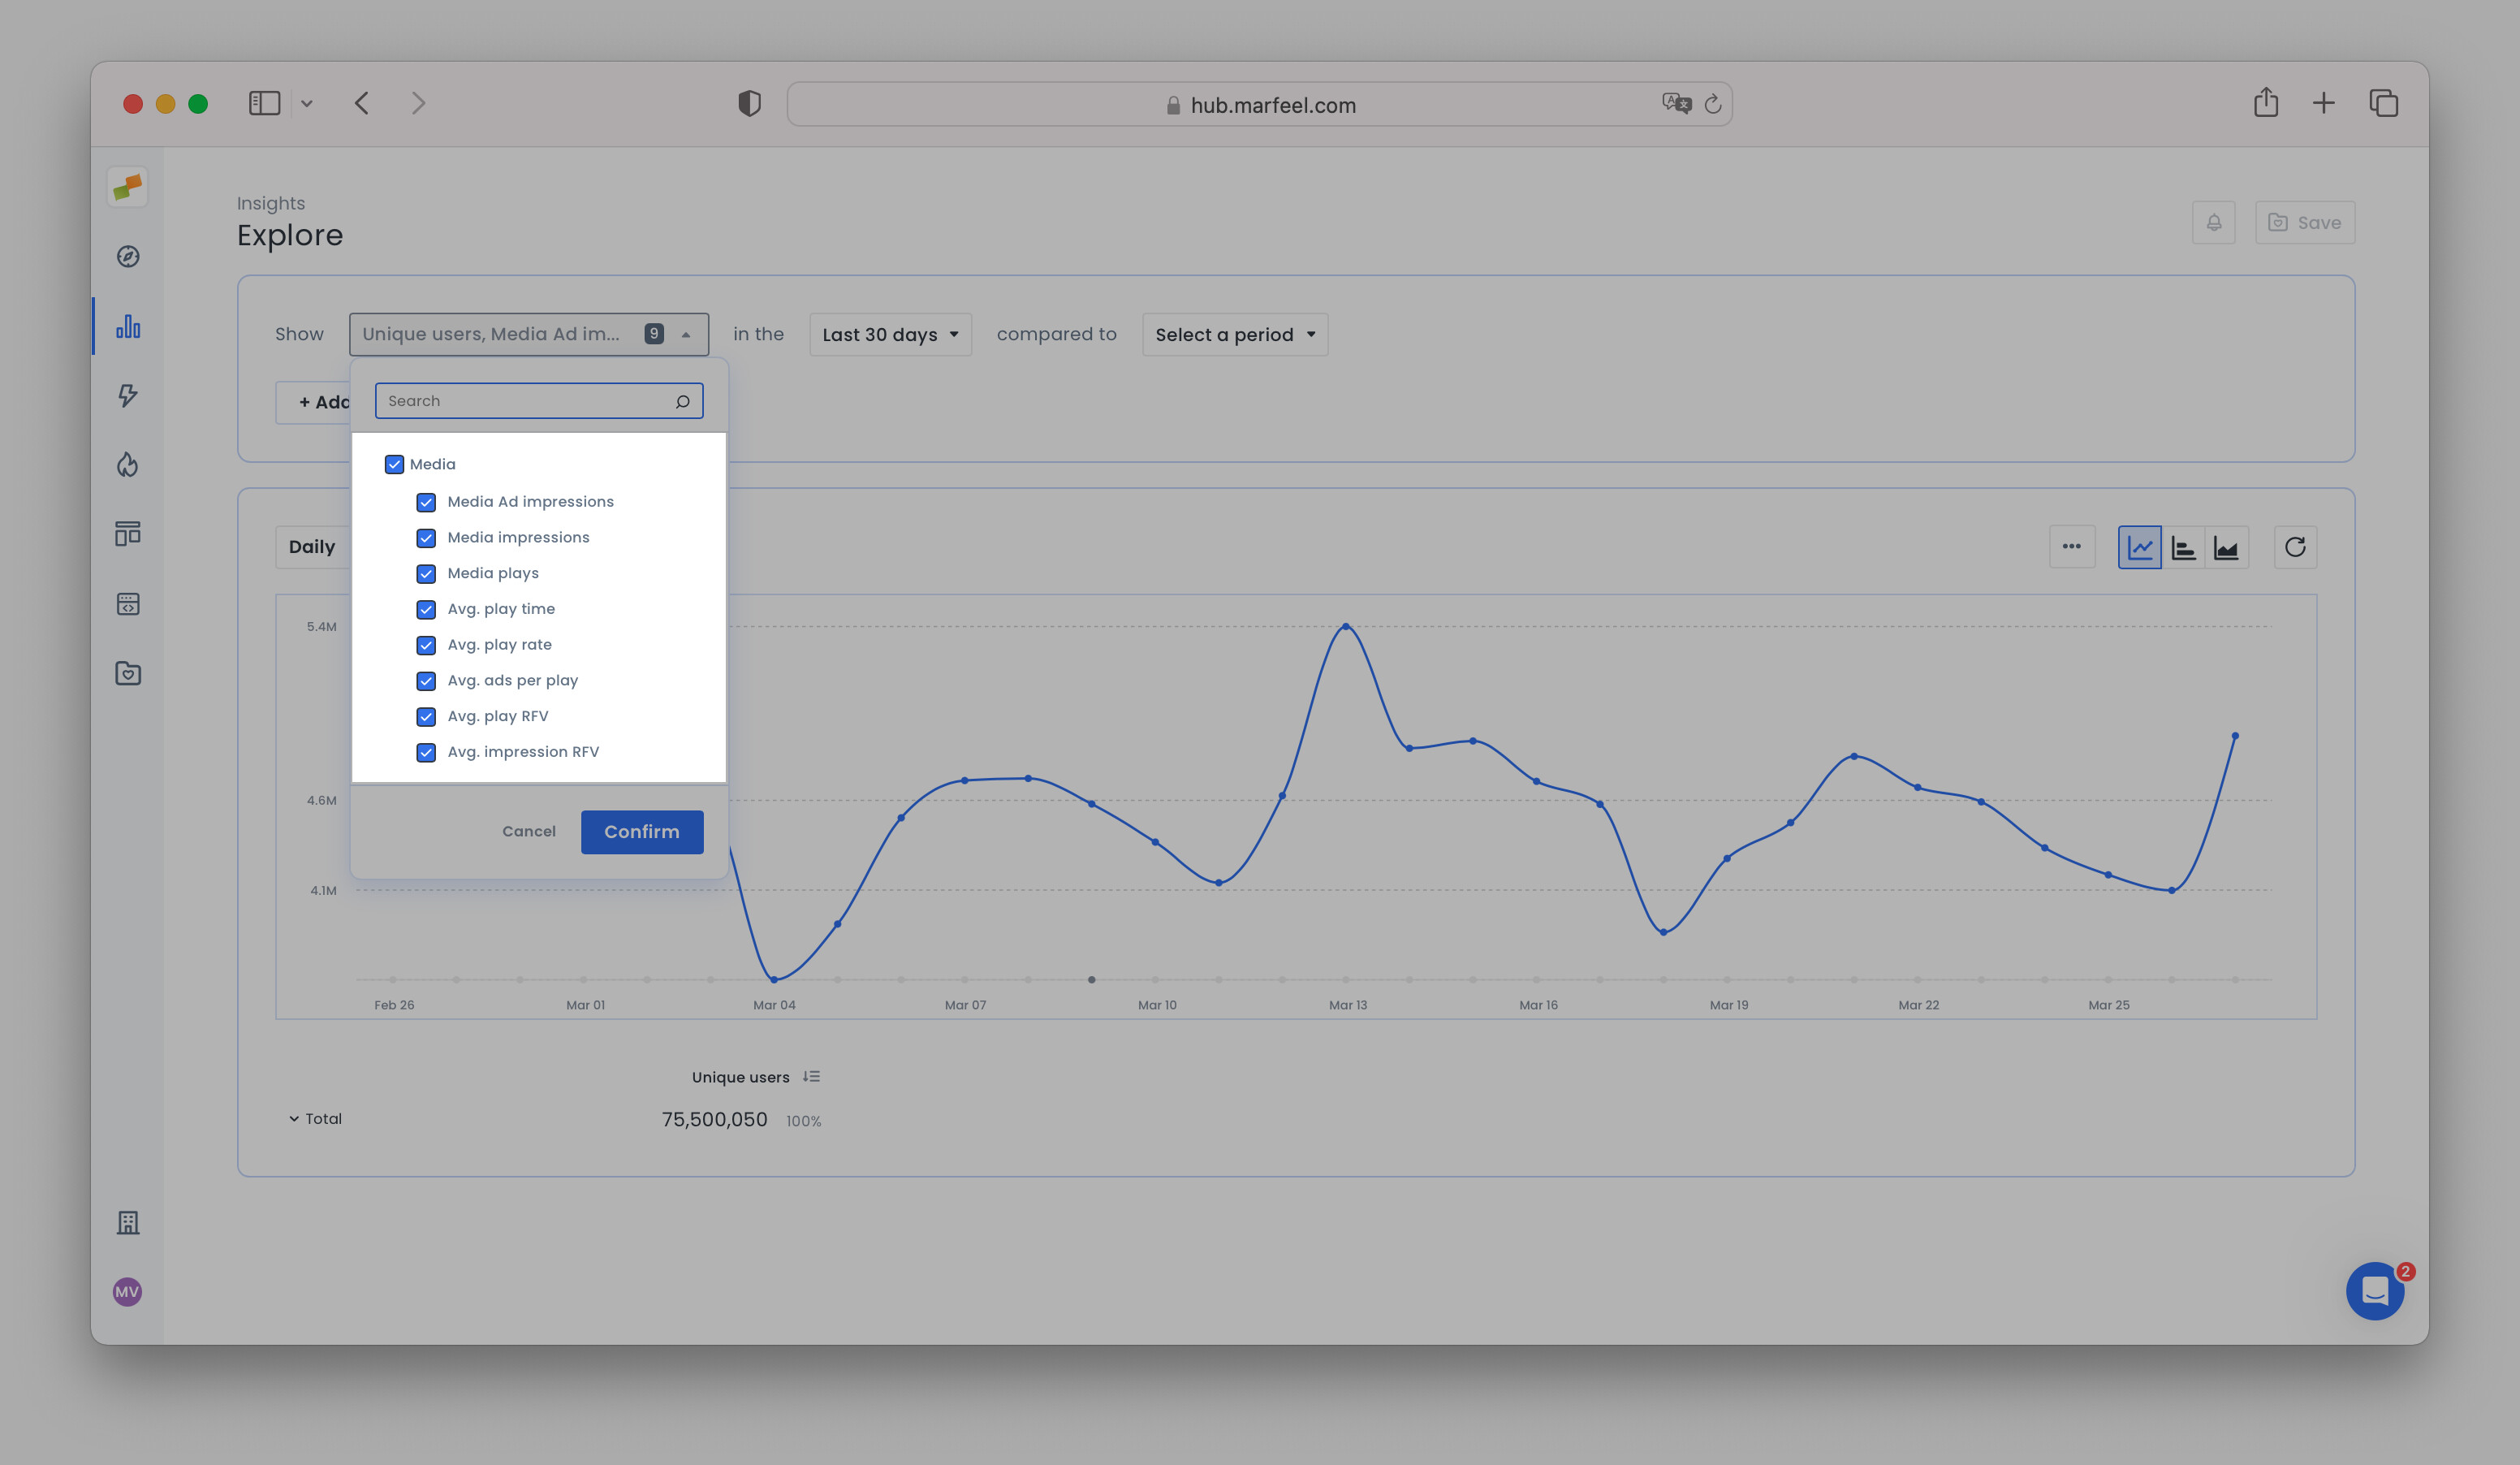
Section titled “Detailed metrics & ad inventory sizing”For a more detailed view of your multimedia data, head over to the Explore tab under Insights where you can manually select metrics related to Multimedia, such as media plays, impressions, avg. play time, and ad impressions, among others. For a complete reference of available multimedia metrics and dimensions, see the Media Metrics & Dimensions guide.
All of this data can be filtered and segmented according to Marfeel’s extensive list of editorial dimensions, allowing you to accurately measure your inventory for advertising. With this data, you can build more targeted audiences for your advertising partners.
Filter multimedia plays by content type and delivery method
Section titled “Filter multimedia plays by content type and delivery method”Explore reports break down multimedia plays by content type (audio or video) and delivery method (streaming for live broadcasts, on demand for pre-recorded content). You can also track unique play users for each combination, letting you measure reach rather than just volume.
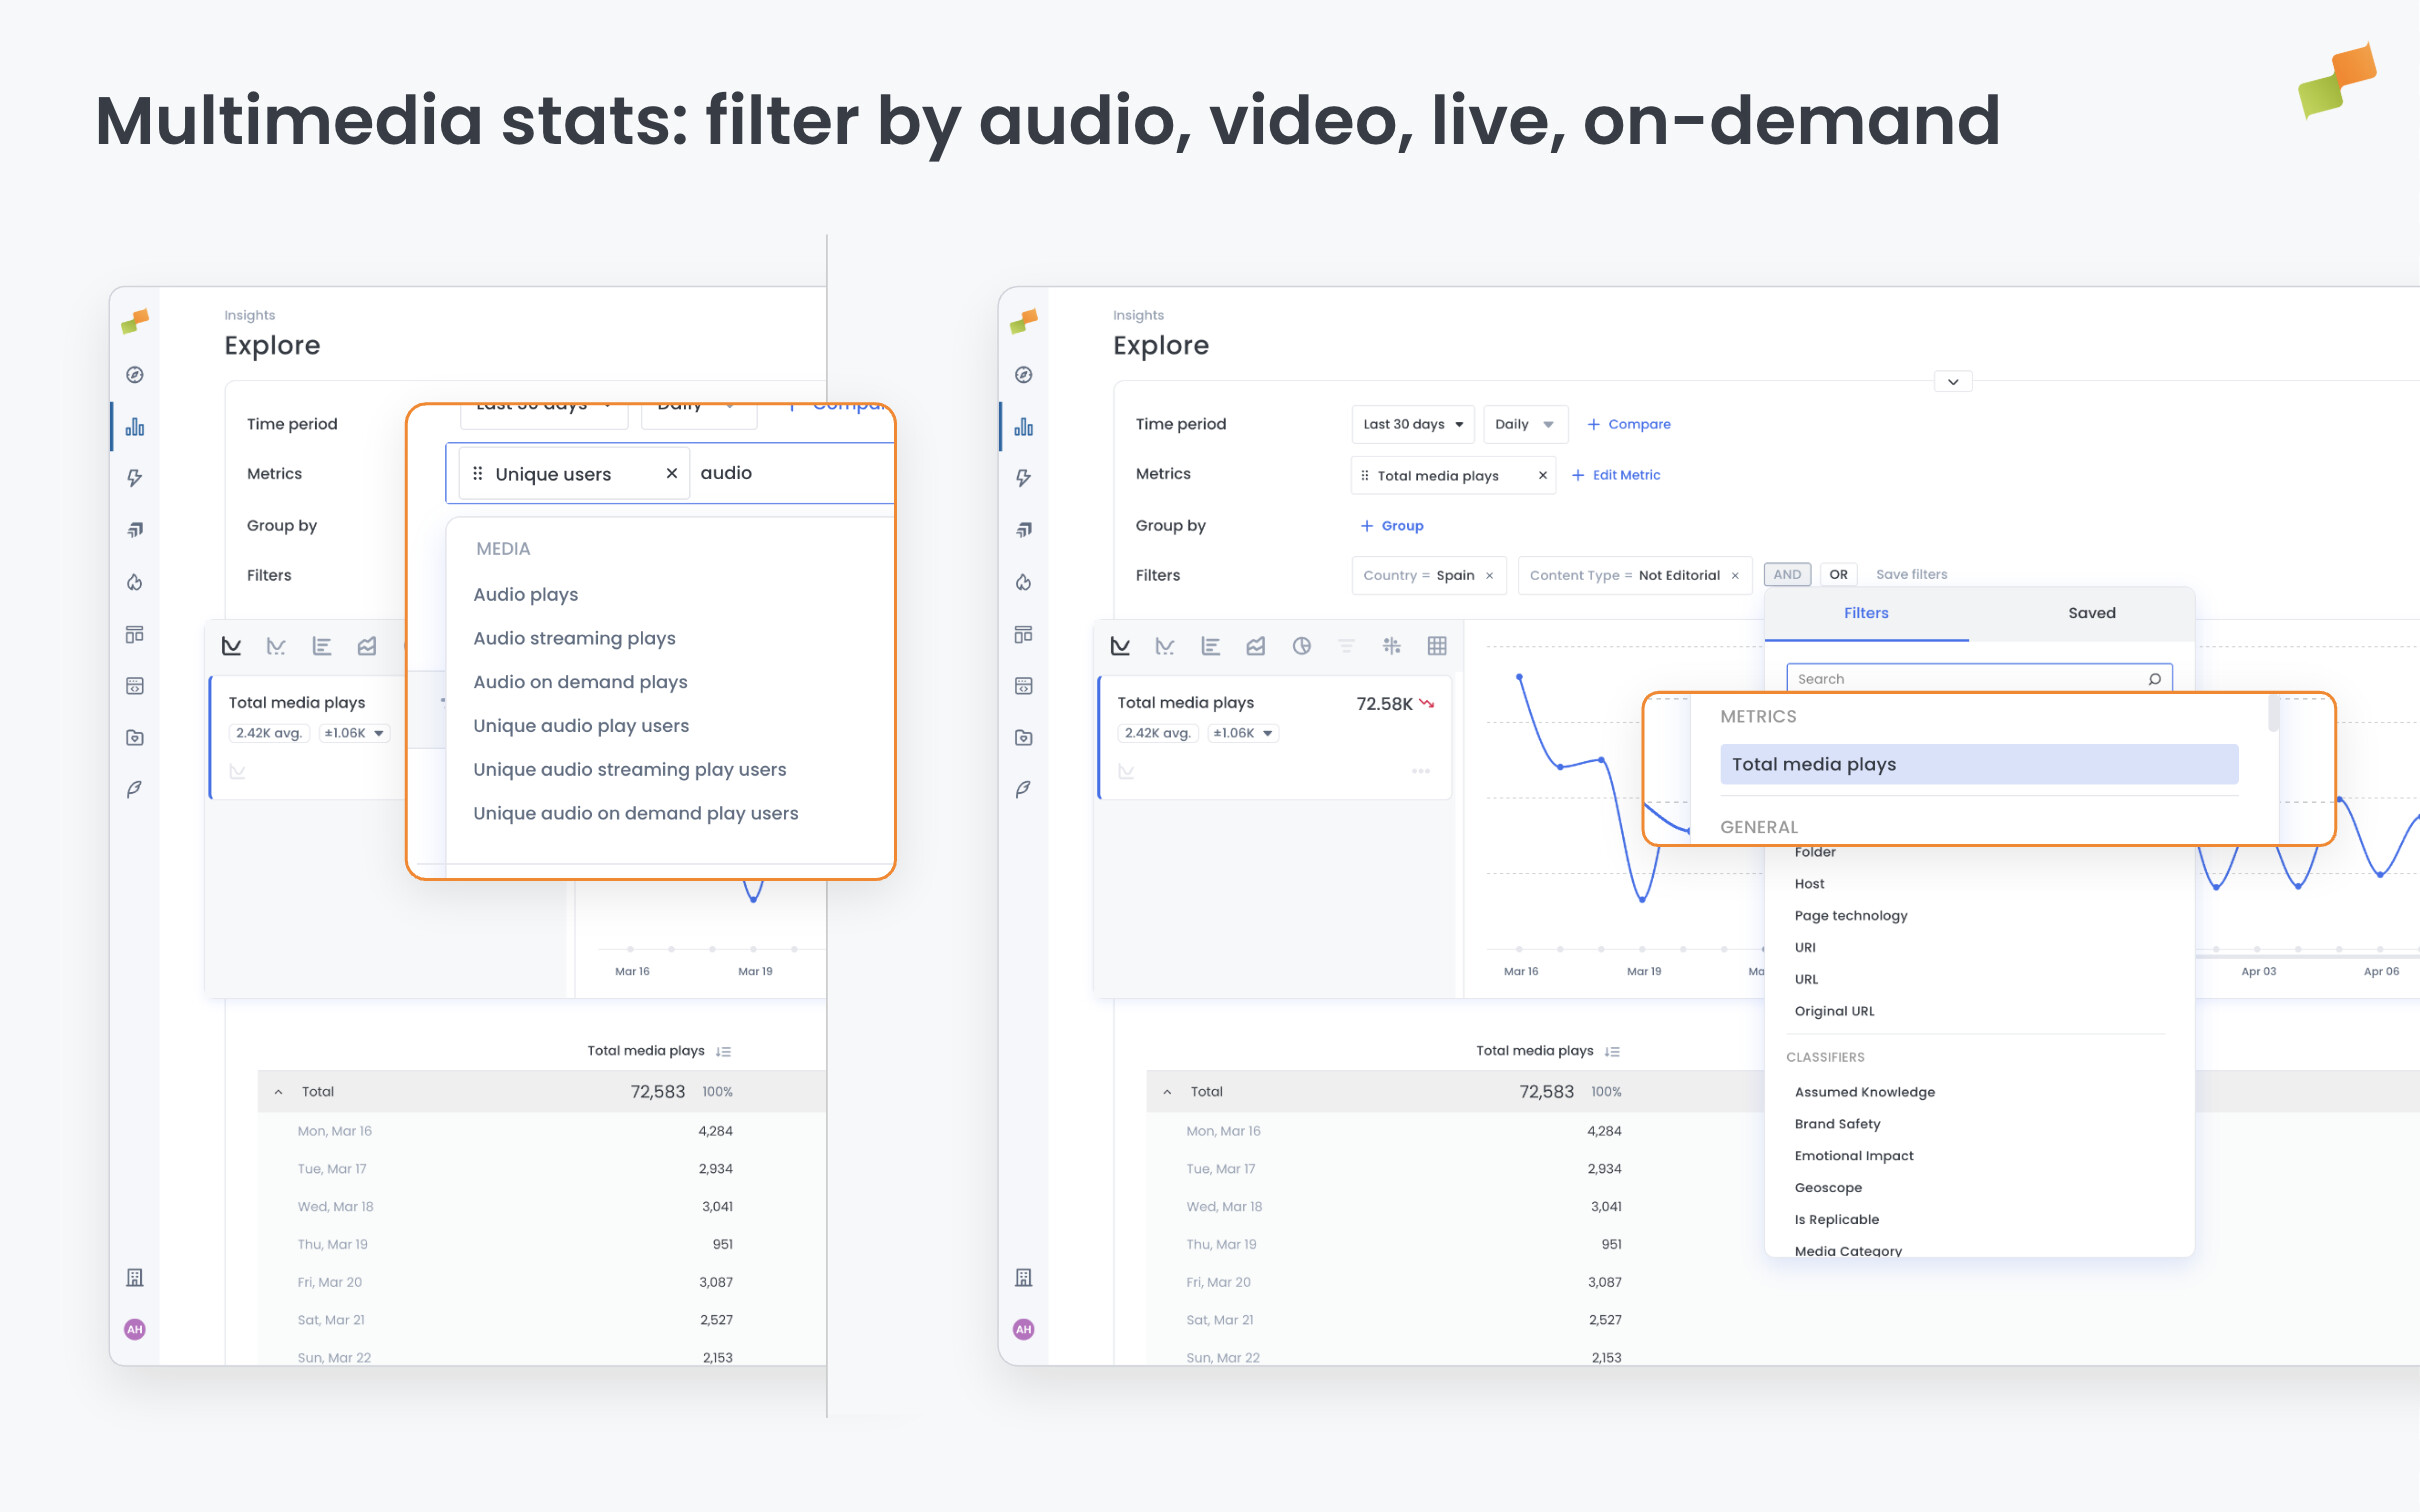
Available metrics include:
- Audio plays / Video plays — plays broken down by content type
- Streaming plays / On demand plays — plays broken down by delivery method
- Audio streaming plays, Audio on demand plays, Video streaming plays, Video on demand plays — plays broken down by both content type and delivery method
- Unique play users variants — each of the above has a corresponding unique play users metric (e.g. Unique audio play users, Unique streaming play users) that counts distinct users rather than total play events
These metrics are available across all historical date ranges in Explore, consistent with the way existing multimedia metrics work. For definitions of each metric, see the Media Metrics & Dimensions guide or the Metrics & Dimensions Glossary.
For a detailed breakdown of everything Marfeel Multimedia Analytics can do, refer to the following video.
https://youtu.be/MEUVBa1y9-M?list=PL6qCNCviEAH7fSW8yZpMORNHHJOhrA87F
The multimedia module can be implemented via a no-code integration, which you can find here. For technical details on how Compass tracks multimedia events such as load, play, pause, and fullscreen, see the Multimedia tracking documentation.
What metrics can I track with Marfeel Multimedia Analytics?
You can track real-time concurrent viewers, accumulated loads vs. plays, player analysis (pause and drop-off points), conversion funnels (load, start, ad start, completion), video insights (unique viewers, minutes viewed, audience retention, average and total ads played), and live vs. on-demand plays.
How can I segment my multimedia audience by user type?
Use the Audience Loyalty Funnel in the multimedia detail view. Click the three dots next to it and select “plot to main graph” to split concurrent viewers by user type — New users, Casual users, and Lovers — so you can make editorial decisions based on which segments engage most with your video content.
Where can I find detailed historical multimedia data?
Head to the Explore tab under Insights, where you can select multimedia-specific metrics such as media plays, impressions, avg. play time, and ad impressions. This data can be filtered and segmented by editorial dimensions to accurately measure your ad inventory. For a full list of available metrics, see the Media Metrics & Dimensions guide.