
Core web vitals: LCP, CLS, and INP explained
Marfeel’s Core Web Vitals module tracks the performance metrics that directly affect Google rankings: LCP, CLS, INP, and more. All data comes from real user sessions, giving you actionable insights to identify and prioritize the most damaging issues impacting your score.
https://www.youtube.com/watch?v=w3Yk3TB0-o4&list=PL6qCNCviEAH7fSW8yZpMORNHHJOhrA87F&index=7
Real User Monitoring (RUM)
Section titled “Real User Monitoring (RUM)”Marfeel provides real-time Core Web Vitals data based on actual user sessions, not synthetic traffic or server simulations. Every pageview is tracked using the Performance Observer API, so you never need to wait for an updated CrUX report.
RUM data is especially important for INP, the newest Core Web Vital introduced by Google, which replaced FID in March 2024. INP is measured based on RUM. This introduces complexity, variability, and difficulty in diagnosing issues. A page may perform fine on your high-end laptop, but your site visitors may not be as lucky.
Marfeel provides contextual data that highlights the specific interaction responsible for the INP value. Where Google Search Console groups pages and gives a consolidated INP value with sample URLs, Marfeel provides granular data down to the CSS selector level. PageSpeed Insights often lacks enough URL-specific data to show real user information and falls back on consolidated data that lacks actionable detail.
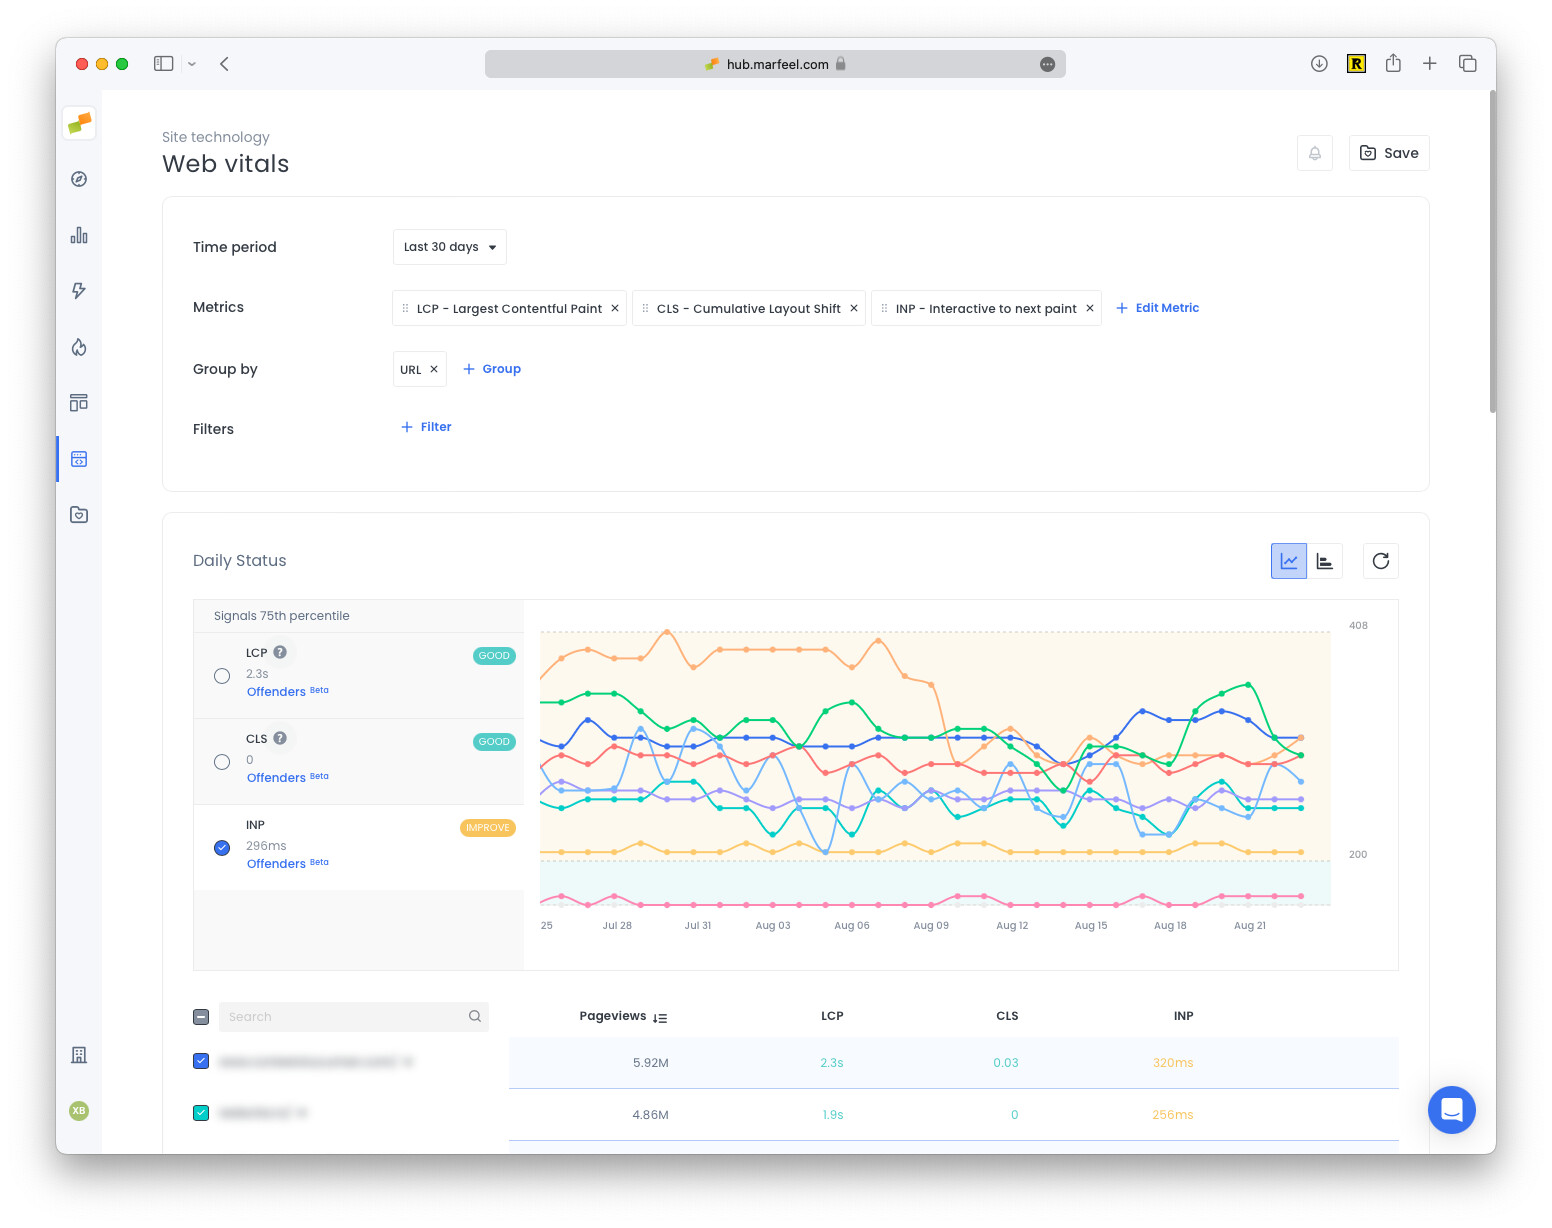
Core web vitals insights are located under Site Technology > Web Vitals.
Largest Contentful Paint (LCP)
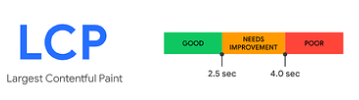
Section titled “Largest Contentful Paint (LCP)”LCP measures the time it takes for a page’s largest image or text block to render relative to when the page first loads. A good LCP score is under 2.5 seconds.
Cumulative Layout Shift (CLS)
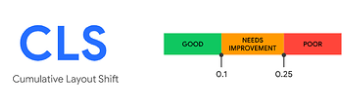
Section titled “Cumulative Layout Shift (CLS)”CLS tracks layout shifts reported when a visible element changes its start position between two frames. A good CLS score is less than 0.1.
Interaction to Next Paint (INP)
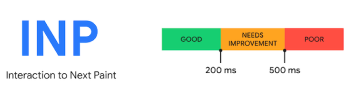
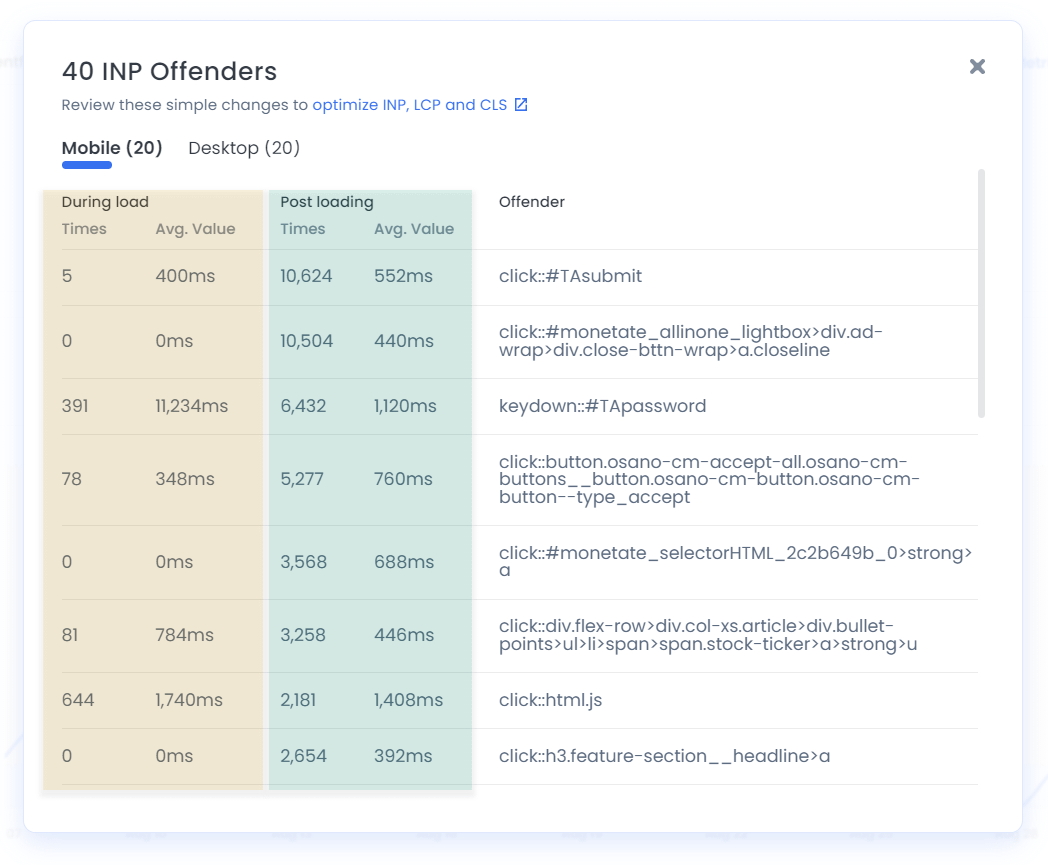
Section titled “Interaction to Next Paint (INP)”INP measures the time from when a user clicks or types on a page until the page is next able to update. It captures the slowest interaction on the page, which should not exceed 200 ms to be considered a good INP score.
INP is measured from real users via RUM. A page may seem fine on your high-end desktop or phone, but your site visitors may be using lower-end hardware or interacting with the site differently. This variability makes diagnosing issues more complex, and gathering more feedback through a RUM solution provides the fine-grained information needed to act.
Suboptimal INP response times come from two primary factors:
- The user initiates an interaction while browser processes are still running (“During Load” events).
- The user engages with an element after the page has fully loaded (“Post Loading”).
Marfeel provides detailed insights into the specific point within these two periods when user interactions occur. Technical teams can determine whether delays come from in-process elements like stylesheets, JavaScript, or other CPU processing assets, or from the fully loaded page and the triggered component.
There’s great documentation for INP and here.
First Input Delay (FID)
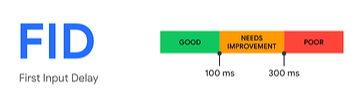
Section titled “First Input Delay (FID)”FID measures the time between when a user attempts to interact with a page, for example by clicking a link, and when the browser starts processing event handlers in response. A good FID score is under 100 ms.
Time To First Byte (TTFB)
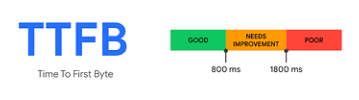
Section titled “Time To First Byte (TTFB)”TTFB measures the time between the request for a resource and when the first byte of a response begins to arrive. Although not considered a core web vital, TTFB is a foundational metric that precedes every other loading metric for navigation requests, including LCP. A good TTFB score is under 800 ms.
Total Blocking Time (TBT)
Section titled “Total Blocking Time (TBT)”Total Blocking Time (TBT) measures the total amount of time after First Contentful Paint (FCP) where the main thread was blocked long enough to prevent input responsiveness. The main thread is considered “blocked” any time there’s a Long Task running for more than 50 milliseconds. The browser cannot interrupt a task in progress, so if a user does interact during a long task, the browser must wait for it to finish before responding.
| Task duration (milliseconds) | Task blocking time (milliseconds) | |
|---|---|---|
| Task one | 250 | 200 |
| Task two | 90 | 40 |
| Task three | 35 | 0 |
| Task four | 30 | 0 |
| Task five | 155 | 105 |
| Total Blocking Time | 345 milliseconds |
TBT is not part of the Core Web Vitals, but it directly impacts page performance, user experience, and SEO. For a deeper look at how these page speed metrics relate to each other, see the metrics reference.
DOM content loaded
Section titled “DOM content loaded”The DOM (Document Object Model) defines the logical structure of documents. The DOMContentLoaded event fires when all nodes in the page have been constructed in the DOM tree, without waiting for images and CSS to finish loading.
This event is useful for measuring page speed because there’s less to load before it fires. For SEO purposes, Google does not consider this a reliable metric for page performance.
Onload events
Section titled “Onload events”The onload event fires when an object has been loaded. It is most often used within the <body> element to execute a script once a web page has completely loaded all content, including images and iframes.
-
Insights: All about Marfeel’s Core Web Vitals module including filtering capabilities and the CWV Offenders feature
-
Easy Improvements: Learn how to optimize LCP and CLS with a couple of simple fixes
What is Real User Monitoring (RUM) for Core Web Vitals?
RUM measures Core Web Vitals from actual user sessions instead of synthetic traffic or server simulations. Marfeel tracks every pageview using the Performance Observer API and Google’s web-vitals library, providing real-time data without waiting for CrUX report updates.
Why is INP measured from real users?
INP captures the slowest interaction on a page as experienced by real visitors. A page may perform well on a high-end device but struggle on lower-end hardware. RUM captures this variability, and Marfeel provides granular data down to the CSS selector responsible for the delay.
What is a good score for each Core Web Vital?
LCP should be under 2.5 seconds, CLS should be less than 0.1, INP should not exceed 200 ms, FID should be under 100 ms, and TTFB should be under 800 ms.