
MarfeelCast traffic share and volatility benchmarking
MarfeelCast lets you compare your traffic acquisition against Marfeel’s entire publisher network, so you can tell whether a spike or drop is unique to your site or part of a broader market shift. It displays your share per traffic source, benchmarks it against the network over time, and provides a volatility index that shows how predictable each channel’s traffic is.
MarfeelCast helps you answer these questions:
- Has the traffic fallen for other publishers too, or am I alone in this? Has there been a platform-related issue (Google, Facebook, etc.) or a core update?
- Is my site’s traffic overexposed or underexposed to Google Discover or to any other traffic sources?
- How volatile is the channel? Is my traffic more volatile than for others?
https://www.youtube.com/watch?v=EaOYzdEFheU
MarfeelCast metrics
Section titled “MarfeelCast metrics”MarfeelCast provides several metrics to help analysts understand how traffic is distributed across channels and how each channel compares to the Marfeel network benchmark.
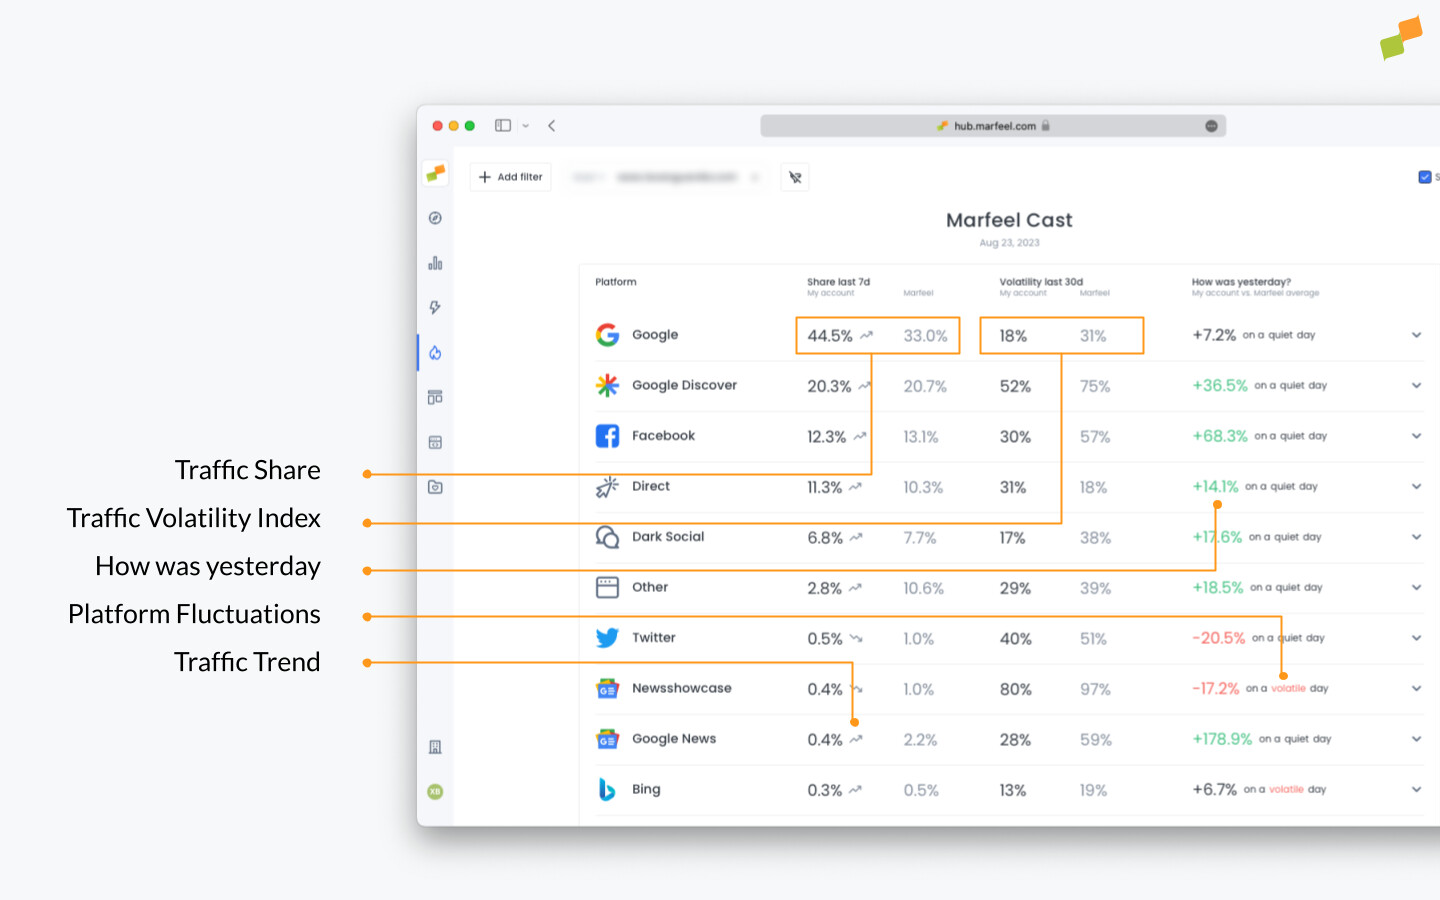
Traffic Share last 7 days
Section titled “Traffic Share last 7 days”Traffic Share describes the percentage of traffic a publisher receives from a given source compared to the total. The metric in the table is calculated for the last 7 days, and the graphic provides a daily timeseries.
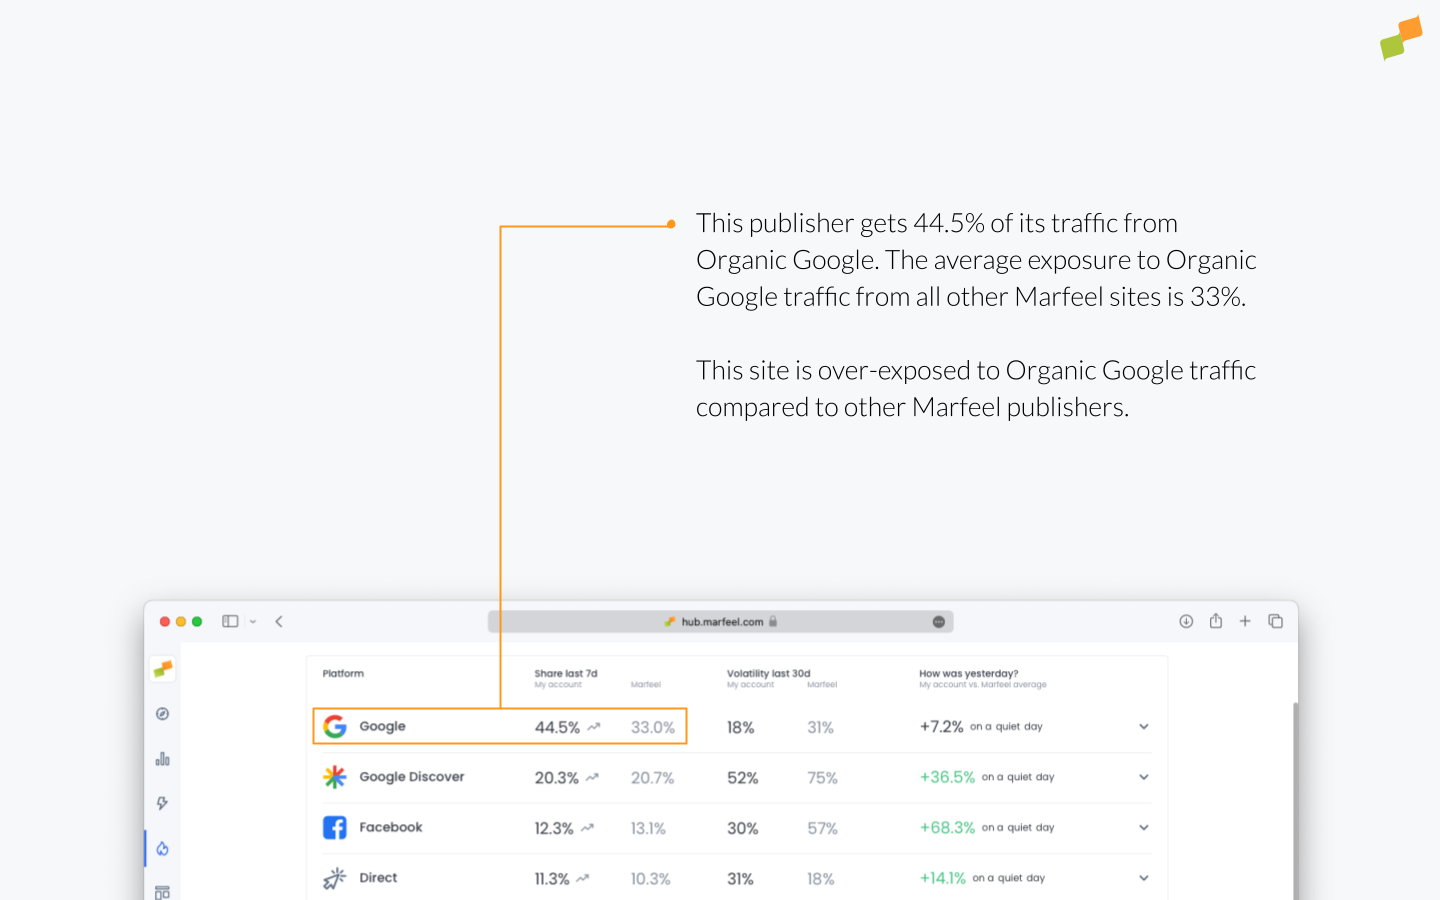
Benchmarking Traffic Share against the Marfeel average helps publishers understand whether they are over-exposed or under-exposed to a channel.
- Being over-exposed normally means the publisher is performing well on that channel. It also often signals serious opportunities to grow other channels.
- Being under-exposed indicates an opportunity to expand penetration on that channel.
It is possible that an article’s peak performance in one channel might lead to a temporary decrease in performance across other channels.
Traffic Volatility Index last 30d
Section titled “Traffic Volatility Index last 30d”The Volatility Index measures how reliable a channel is at sending a steady flow of traffic. A high number means traffic from that channel is unpredictable, while a low number indicates consistent performance over the last month.
It is calculated for both your own traffic and the Marfeel average as the average week-over-week standard deviation (in absolute numbers) divided by average traffic.
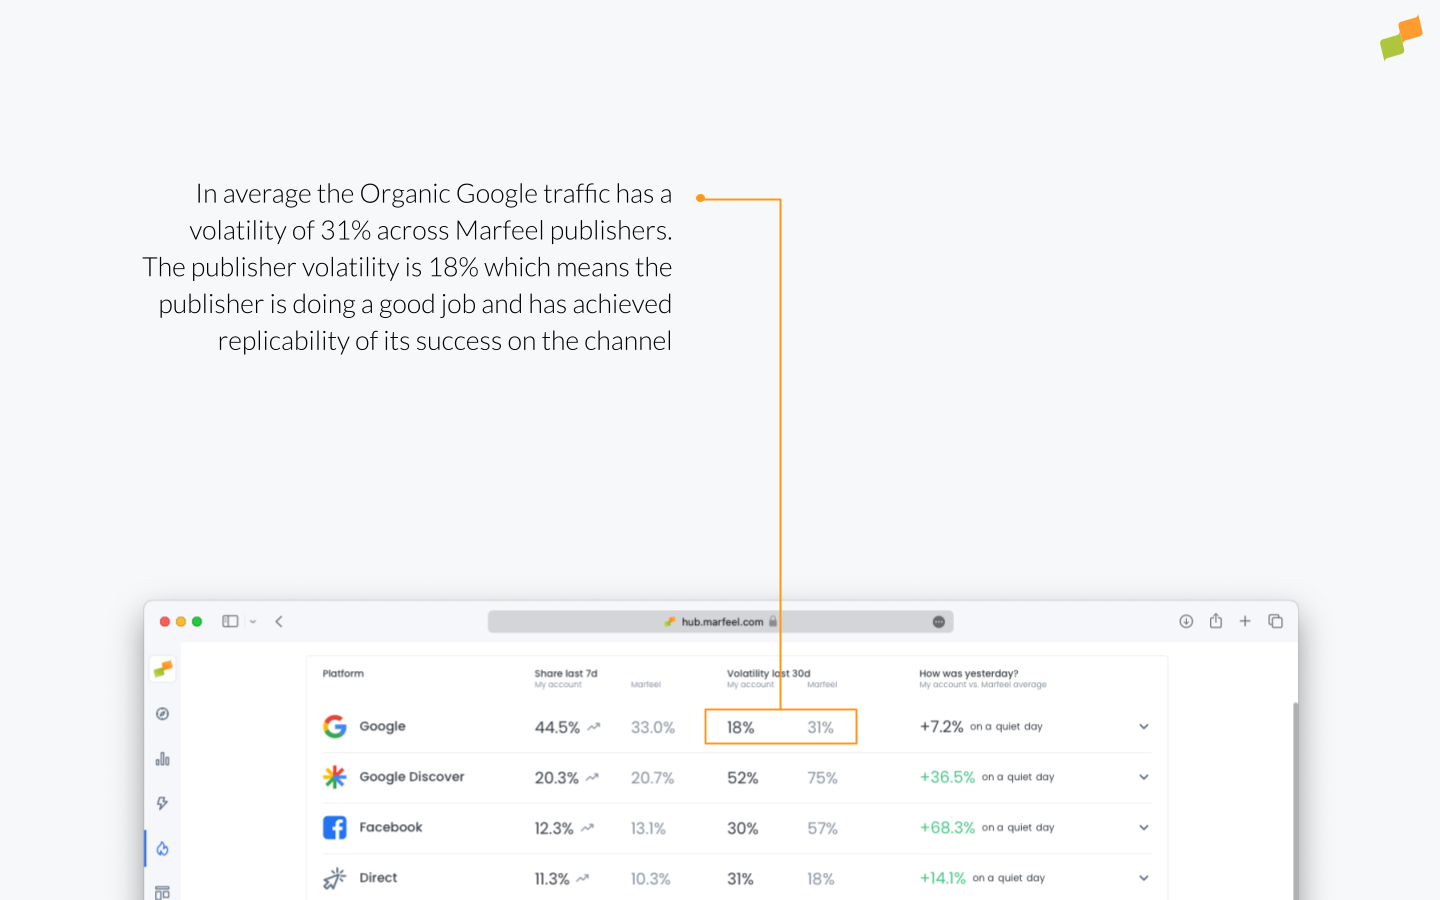
Benchmarking volatility against the Marfeel average helps publishers gauge whether they have achieved predictability on a channel compared to others.
How was yesterday?
Section titled “How was yesterday?”This column shows yesterday’s performance for your account compared to the same day of the previous week. The value is then normalized by subtracting the equivalent calculation averaged across the Marfeel network.
Platform Volatility and Update Detector
Section titled “Platform Volatility and Update Detector”Marfeel checks whether yesterday was a quiet or volatile day across the network. It looks at all accounts and measures what percentage of sites had a relevant standard deviation for each channel.
If many sites experienced a volatile day, it may indicate that external factors like platform changes or core algorithm updates affected that channel’s traffic.
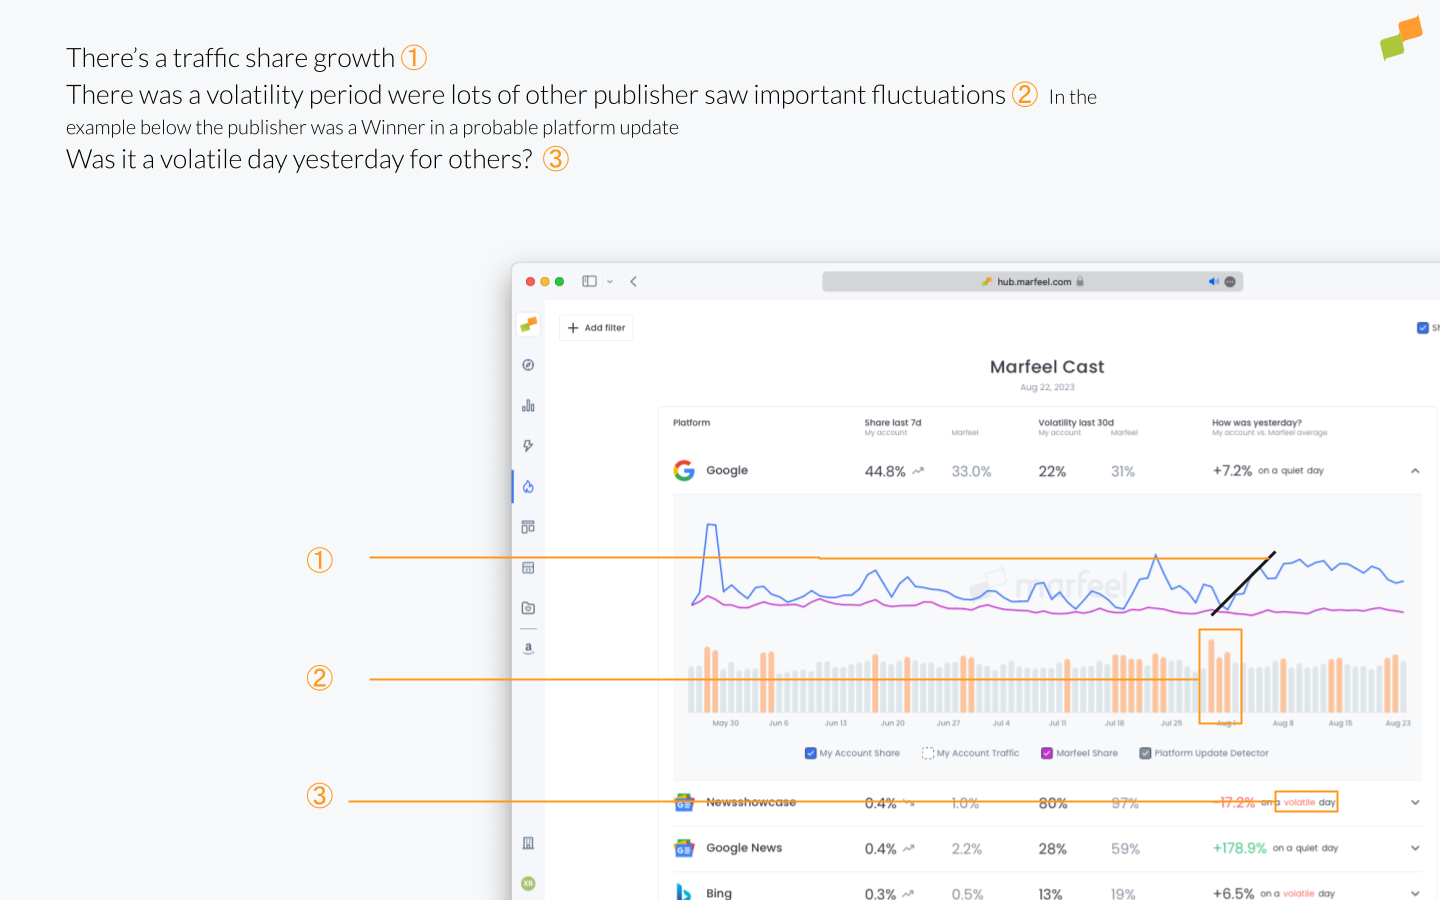
The bars represent daily volatility, normalized to the usual volatility of the channel, by measuring which percentage of sites experienced relevant traffic changes on each day. Above a certain threshold, bars appear in a different color to highlight the highest-volatility dates, which could signal an algorithm update on that traffic source.
Trend is calculated as the regression slope of the last 2 weeks for each channel’s traffic line. When the result is lower than -1% or higher than 1%, a trend arrow appears alongside the last 7 days share number.
It indicates whether last week’s share number is significantly higher or lower than the previous benchmark, and it is highlighted for both your own traffic and Marfeel’s average.
Chart metrics
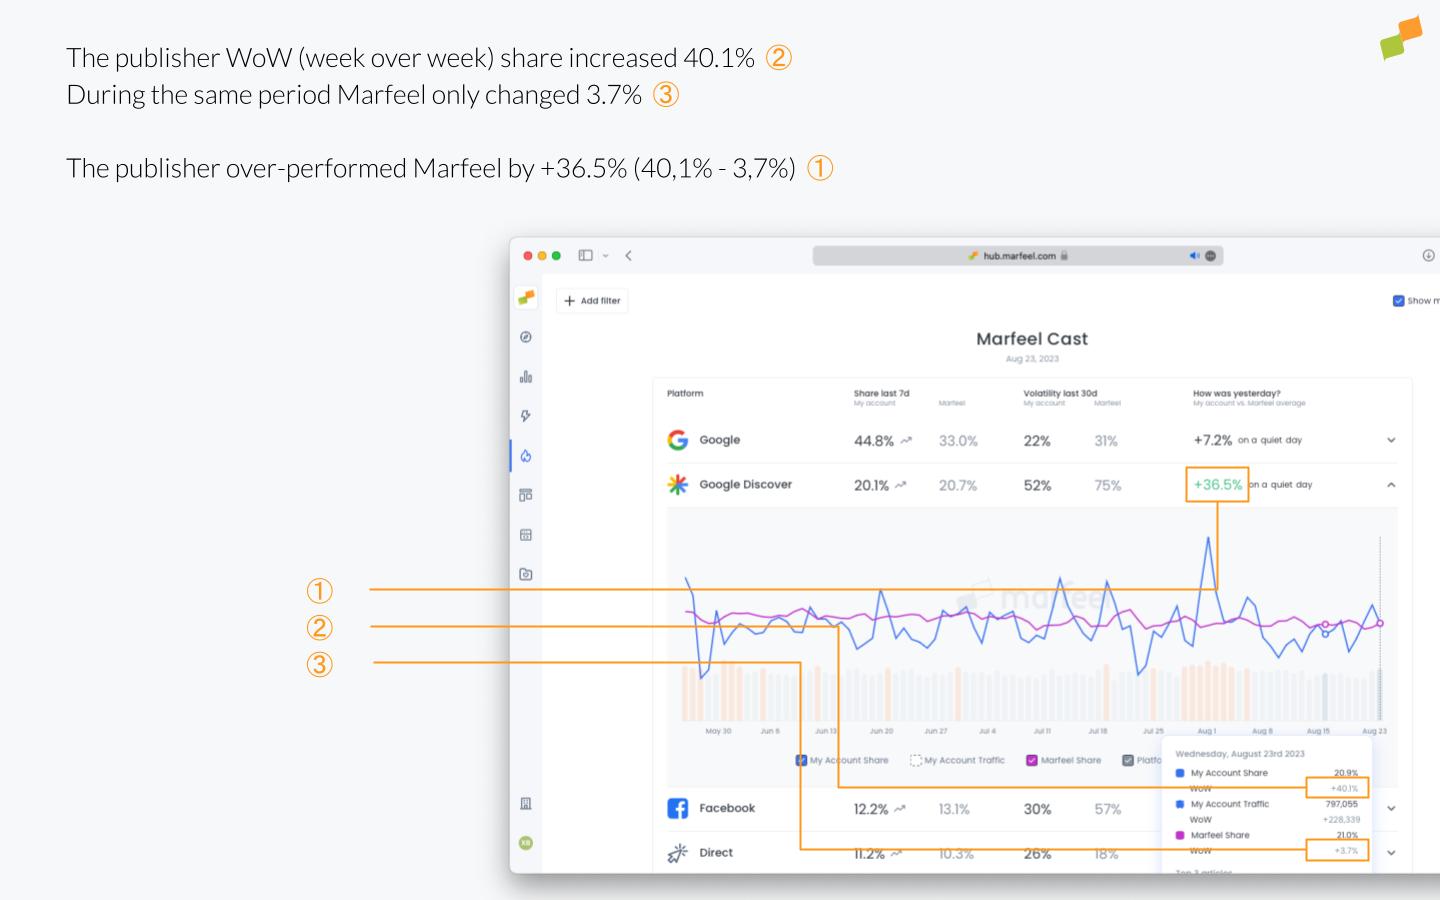
Section titled “Chart metrics”Each table row is expandable, displaying the last 90 days of data on a chart. Four different metrics are plotted, and hovering over the chart displays a tooltip with more detailed information.
My Account Share
Section titled “My Account Share”This line represents the share of your account’s traffic that came from the expanded channel, for each day. The average is logarithmically weighted by domain.
My Account Traffic
Section titled “My Account Traffic”This line represents the actual traffic from the expanded source channel in absolute numbers.
This is useful for understanding whether a change in traffic share was caused by surges or drops in other channels rather than in this one.
Marfeel Share
Section titled “Marfeel Share”This line represents the average share of all Marfeel accounts’ traffic that came from the expanded channel, for each day. The average is logarithmically weighted by domain.
Tooltip
Section titled “Tooltip”When hovering over the chart, a tooltip displays a table with the values for all three plotted lines (My Account Share, My Account Traffic, and Marfeel Share) along with the week-over-week percentage change for each. The previous-week data point used for the calculation is also highlighted on the chart as a visual reference.
The tooltip also shows the top 3 articles on the channel to help identify what moved the needle on that day.
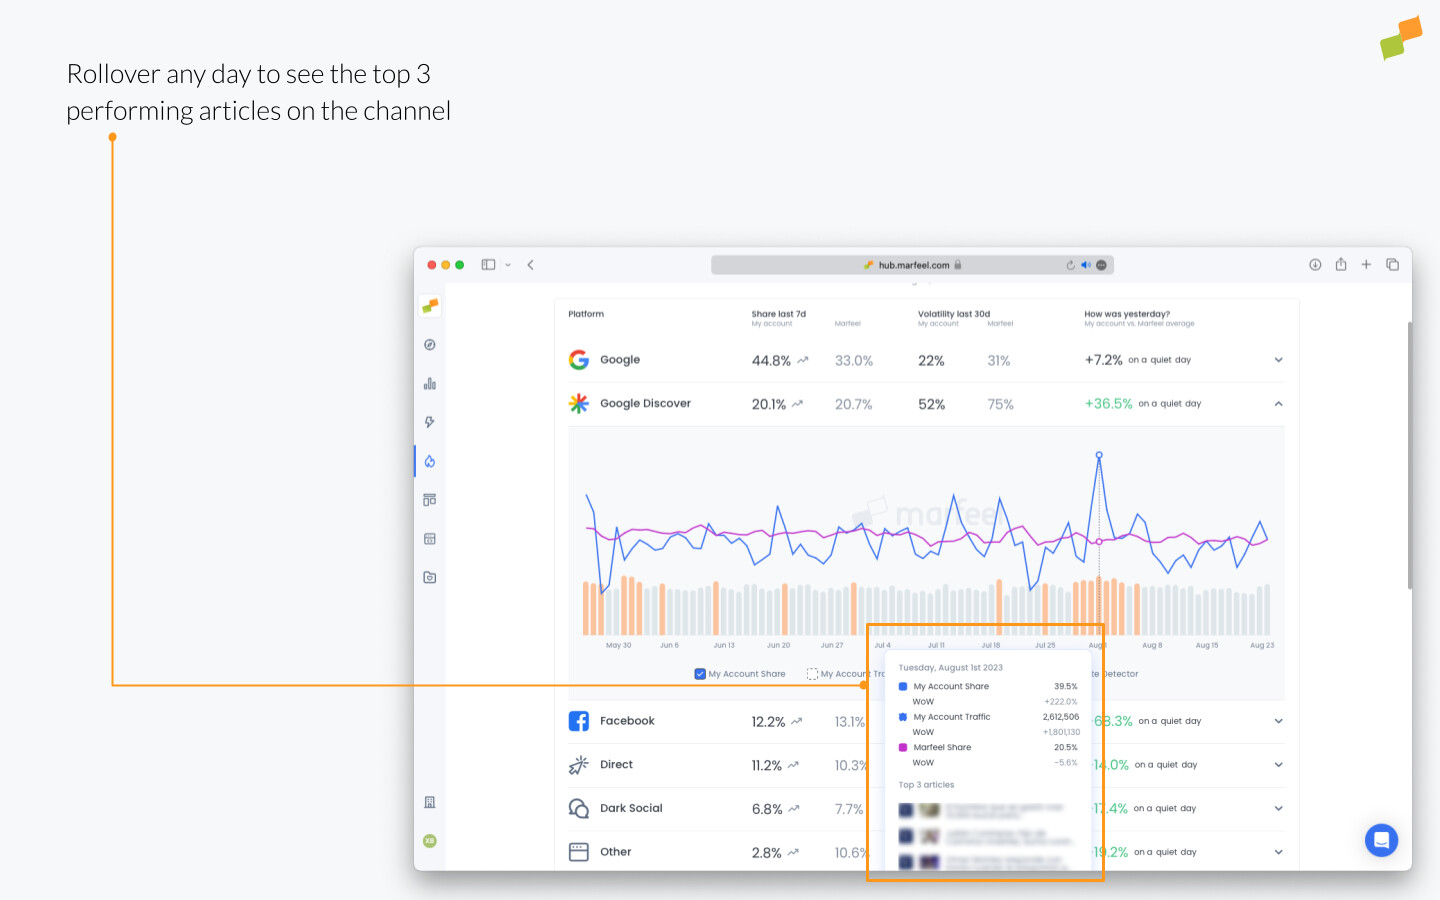
A “Read more” link is included in the tooltip to navigate to the realtime screen, filtered by the selected source channel and date.
Filters
Section titled “Filters”On the top left of the screen, you can filter your site’s data by host and by folder.
On the right side of the screen, you can deactivate showing your site’s data, in case you want to share Marfeel’s average numbers in a screenshot without displaying sensitive data.
Access
Section titled “Access”Access to MarfeelCast module is restricted to analyst roles.
How do I know if a traffic drop is just affecting my site or the entire market?
MarfeelCast compares your traffic share per channel against Marfeel’s full publisher network. If the Marfeel average also dropped, the cause is likely external, such as a platform issue or core update. If only your site dropped, the cause is specific to your content or configuration.
What does the Traffic Volatility Index measure in MarfeelCast?
The Traffic Volatility Index measures how reliable a channel is at delivering steady traffic over the last 30 days. A high number means traffic from that channel is unpredictable, while a low number indicates consistent performance. It is calculated as the average week-over-week standard deviation divided by average traffic, for both your site and the Marfeel network average.
How does MarfeelCast detect platform or algorithm updates?
The Platform Volatility and Update Detector checks what percentage of sites across Marfeel’s network experienced significant traffic changes on a given day. When many sites show high volatility simultaneously, it signals that external factors like a platform change or core algorithm update may be affecting that channel.