
Subscription analytics with Explore view queries
Marfeel’s Explore view gives subscription managers direct access to historical data on subscriber behavior. By combining subscription metrics with engagement dimensions, you can identify which traffic sources bring the most loyal readers, which content sections convert best, and where churn risk is highest.
The queries below walk through the most valuable analyses: finding top acquisition sources, comparing engagement periods, spotting conversion opportunities among anonymous loyals, and identifying at-risk subscribers.
Explore view metrics and dimensions for conversions
Section titled “Explore view metrics and dimensions for conversions”These are the key metrics and dimensions available for subscription analysis in Explore.
Metrics
Section titled “Metrics”- Average RFV: RFV stands for Recency, Frequency, and Volume. It reflects how recently, how often, and how deeply a user engages with your site.
- Cumulative RFV: The sum of all users’ RFV scores over a selected time period, providing a total view of site engagement.
- Unique users: The count of individual users who visited the site during a selected time period.
Dimensions
Section titled “Dimensions”- Visitor loyalty: Segments users into groups based on their RFV score within the loyalty funnel:
- Loyals and lovers: high RFV scores. These users visit frequently and consume significant content per session.
- Casual and fly-by: lower RFV scores. These users visit less often or consume less content per session.
- New: first-time visitors. An anonymous user accessing the site on a new device counts as new. At registration, Marfeel conducts device reconciliation.
- User journey: Categorizes users by subscription status:
- Subscriber: users with an active subscription.
- Registered: users who created an account but have no active subscription.
- Anonymous: users who have not registered or subscribed.
How do the most loyal users access the site?
Section titled “How do the most loyal users access the site?”Search for Unique users filtered by Visitor loyalty = Loyal, Lover grouped by Traffic source with internal.
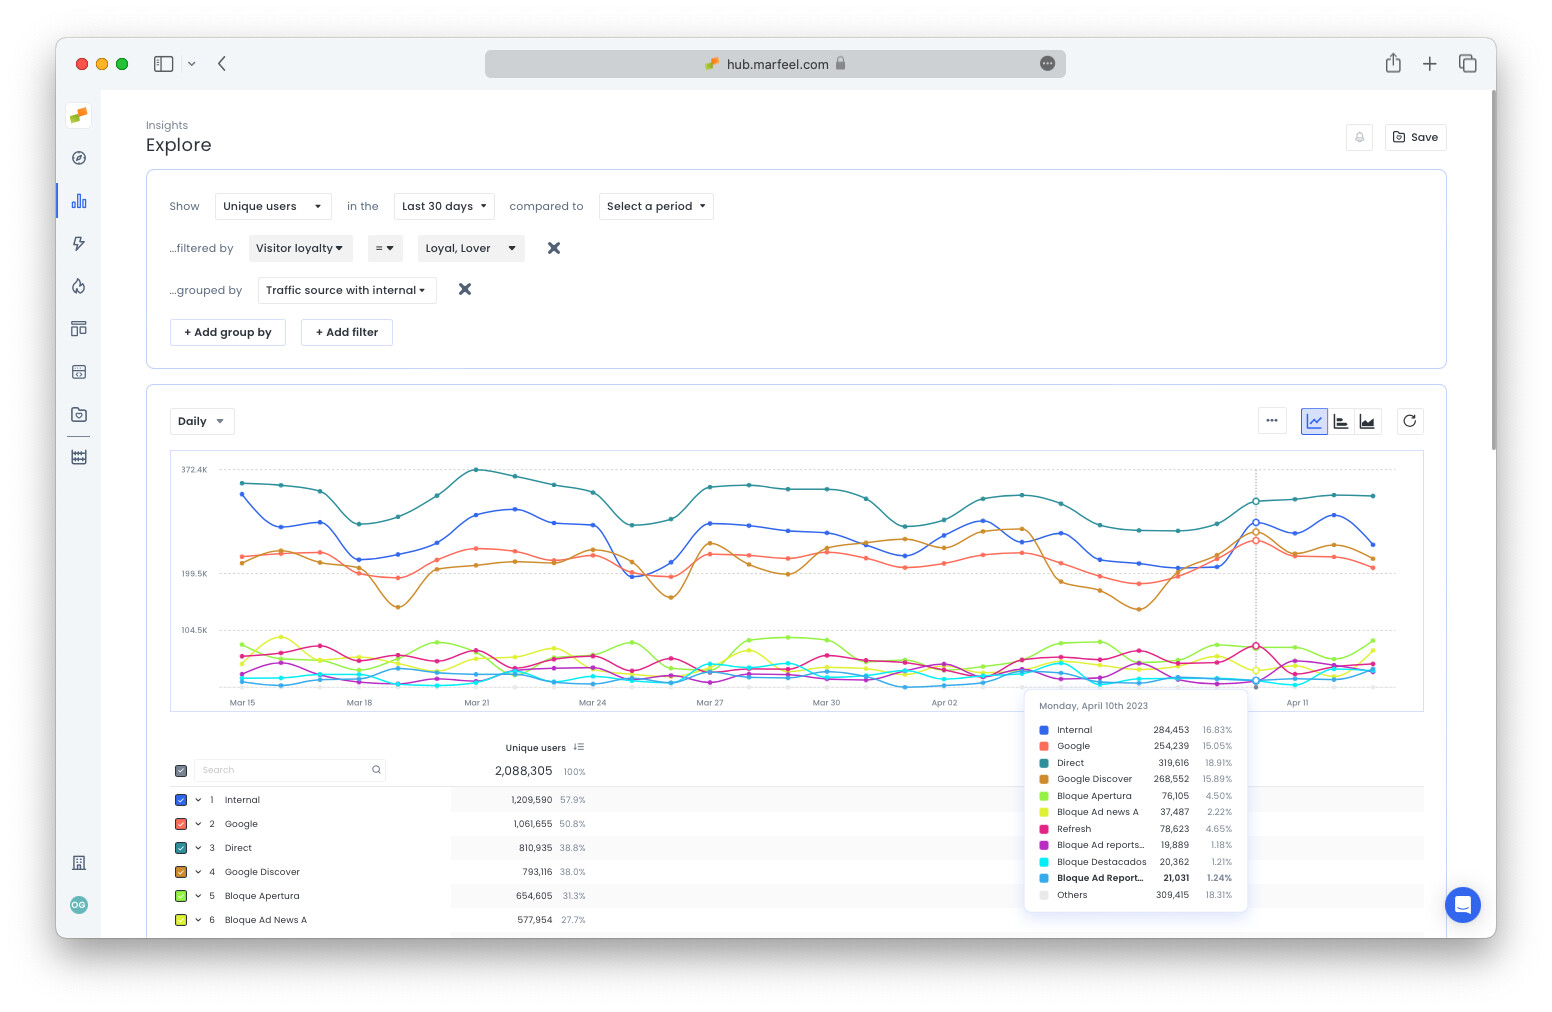
In this example, four main traffic sources stand out:
- Internal (unassigned internal traffic)
- Direct
- Google Discover
Learn more about how Marfeel attributes traffic sources here. See this query in Explore.
How does subscriber engagement compare month over month?
Section titled “How does subscriber engagement compare month over month?”Search for Cumulative RFV, Avg. RFV, and Unique users in the Last 30 days compared to the Preceding period filtered by User journey = Subscriber.
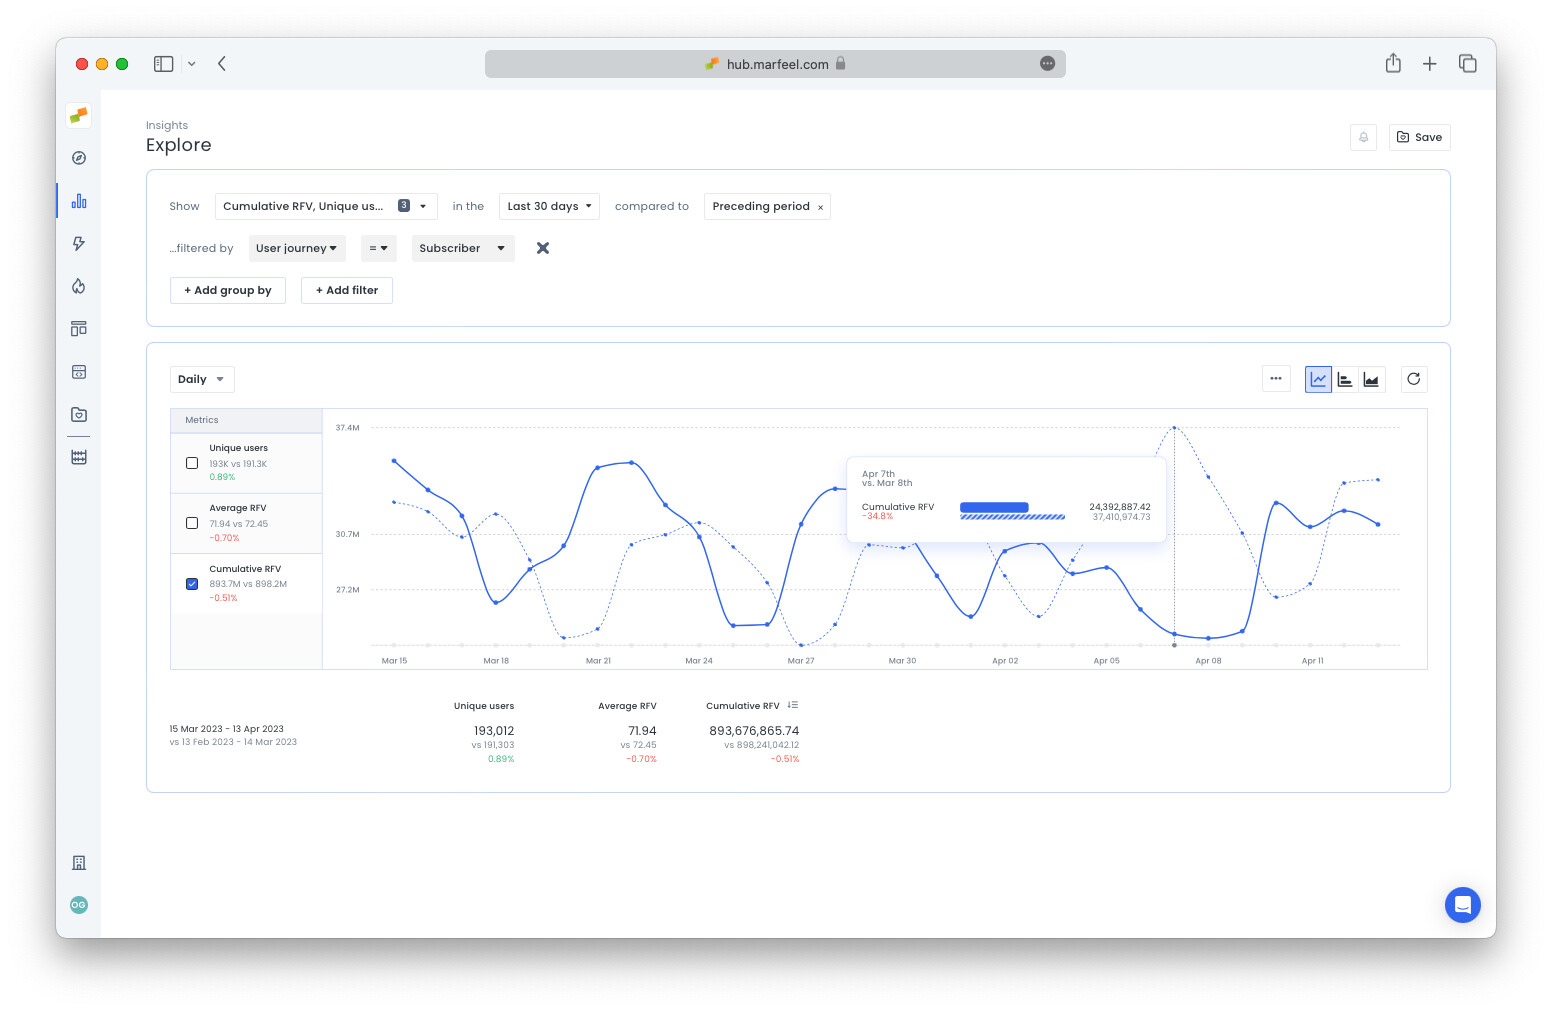
Hover over the data to go deeper into sharp increases or decreases. In this example, the external event International Women’s Day drove a spike in subscriber engagement, but levels evened out over the course of two months.
See it in Explore.
Engagement by section
Section titled “Engagement by section”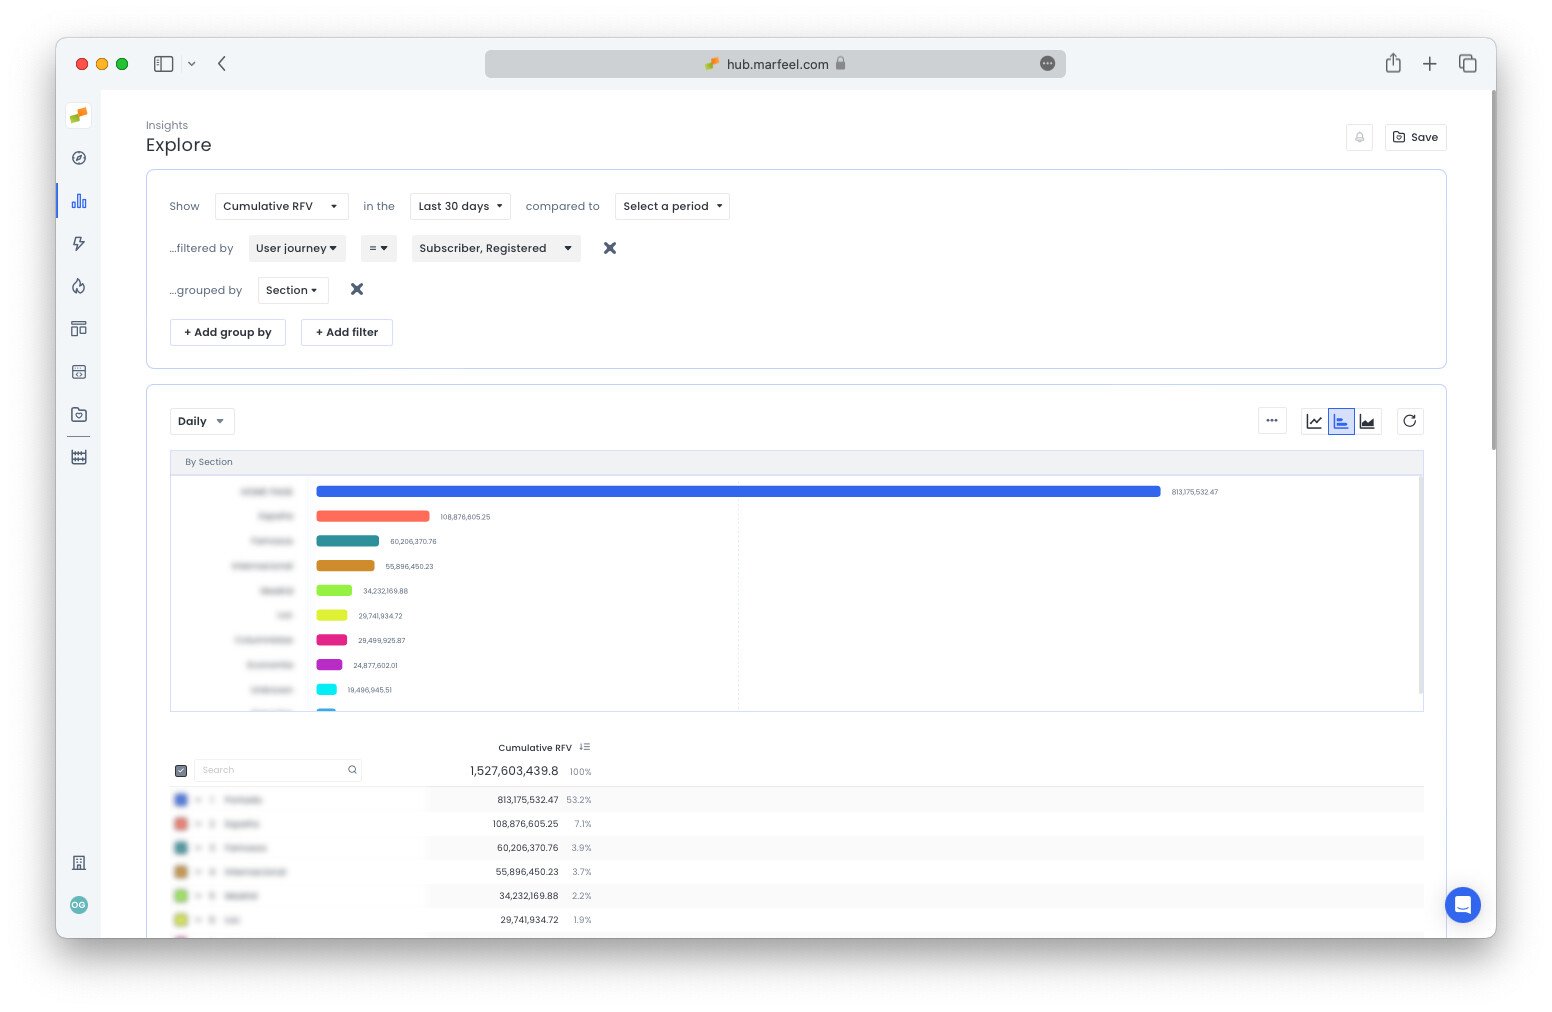
In this example, the home page is where subscribers and registered users spend the most time, by a significant margin.
See it in Explore.
Which sections do loyal anonymous readers prefer?
Section titled “Which sections do loyal anonymous readers prefer?”Search for Unique users filtered by Visitor loyalty = Loyal, Lover and User type = Anonymous grouped by Section.
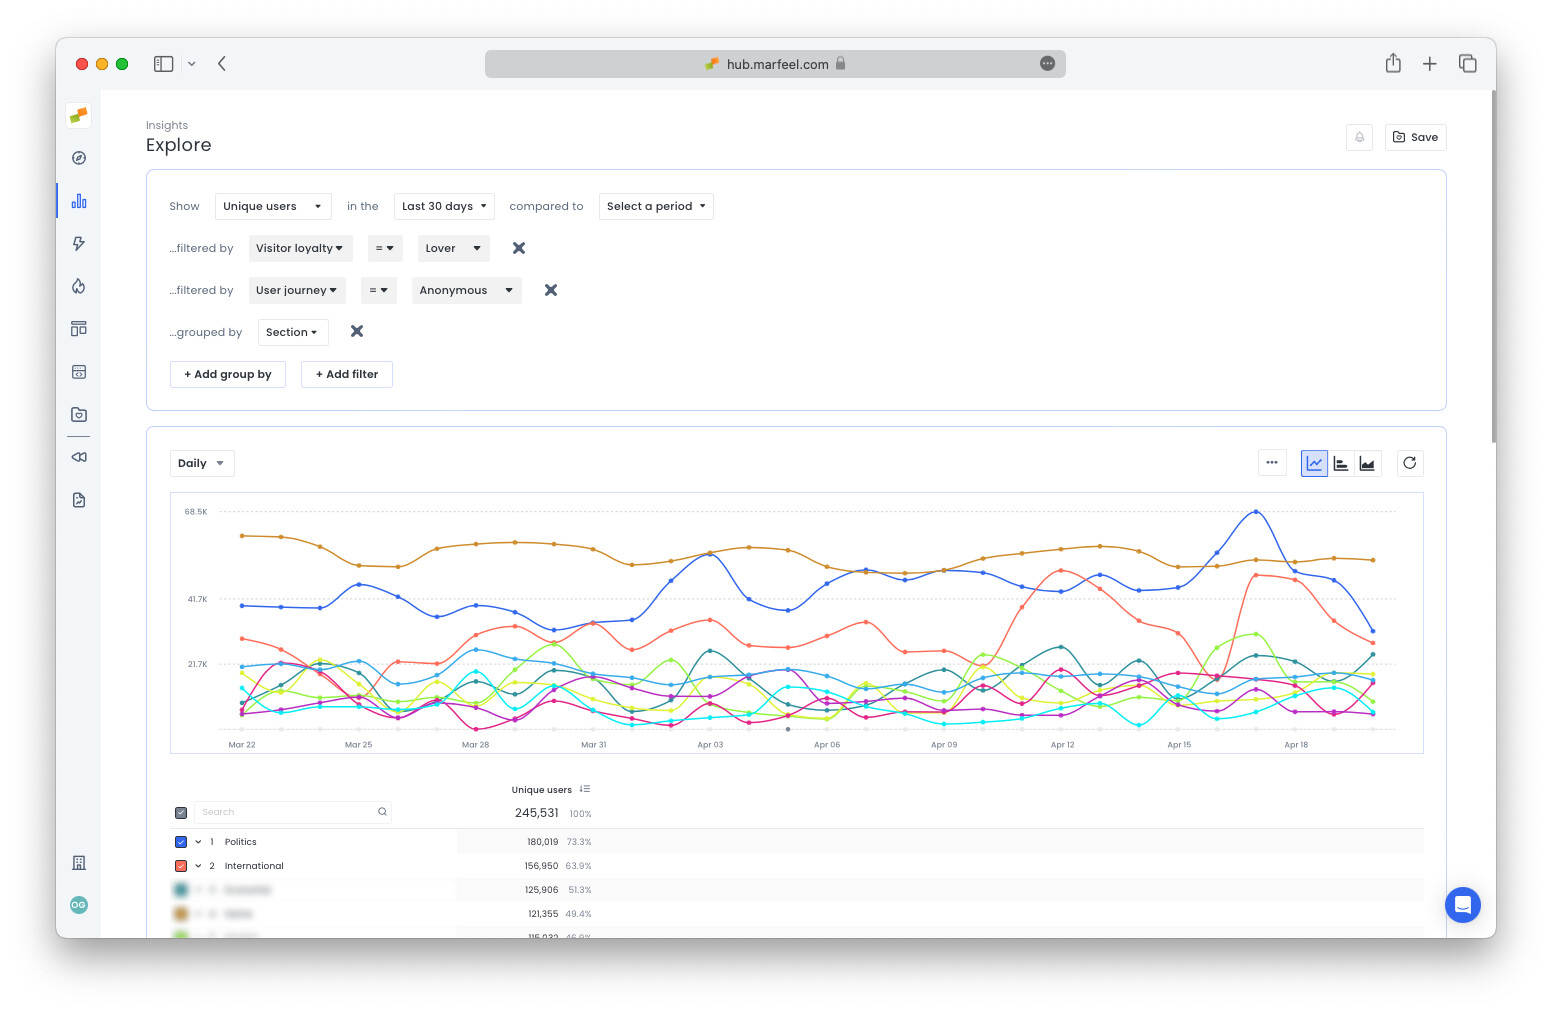
See it in Explore.
The most likely segments of your loyalty funnel to convert make frequent visits to the home page. This is why Marfeel has incorporated subscription optimization into the HUD, so that home page editors can grant visibility to stories with a high propensity to convert.
Which sections attract subscribers at risk of churning?
Section titled “Which sections attract subscribers at risk of churning?”Subscribers who pay for content but rarely visit are high churn risk. To see which sections these users engage with, search for Unique users filtered by Visitor loyalty = Casual, Fly by and User type = Subscriber grouped by Section.
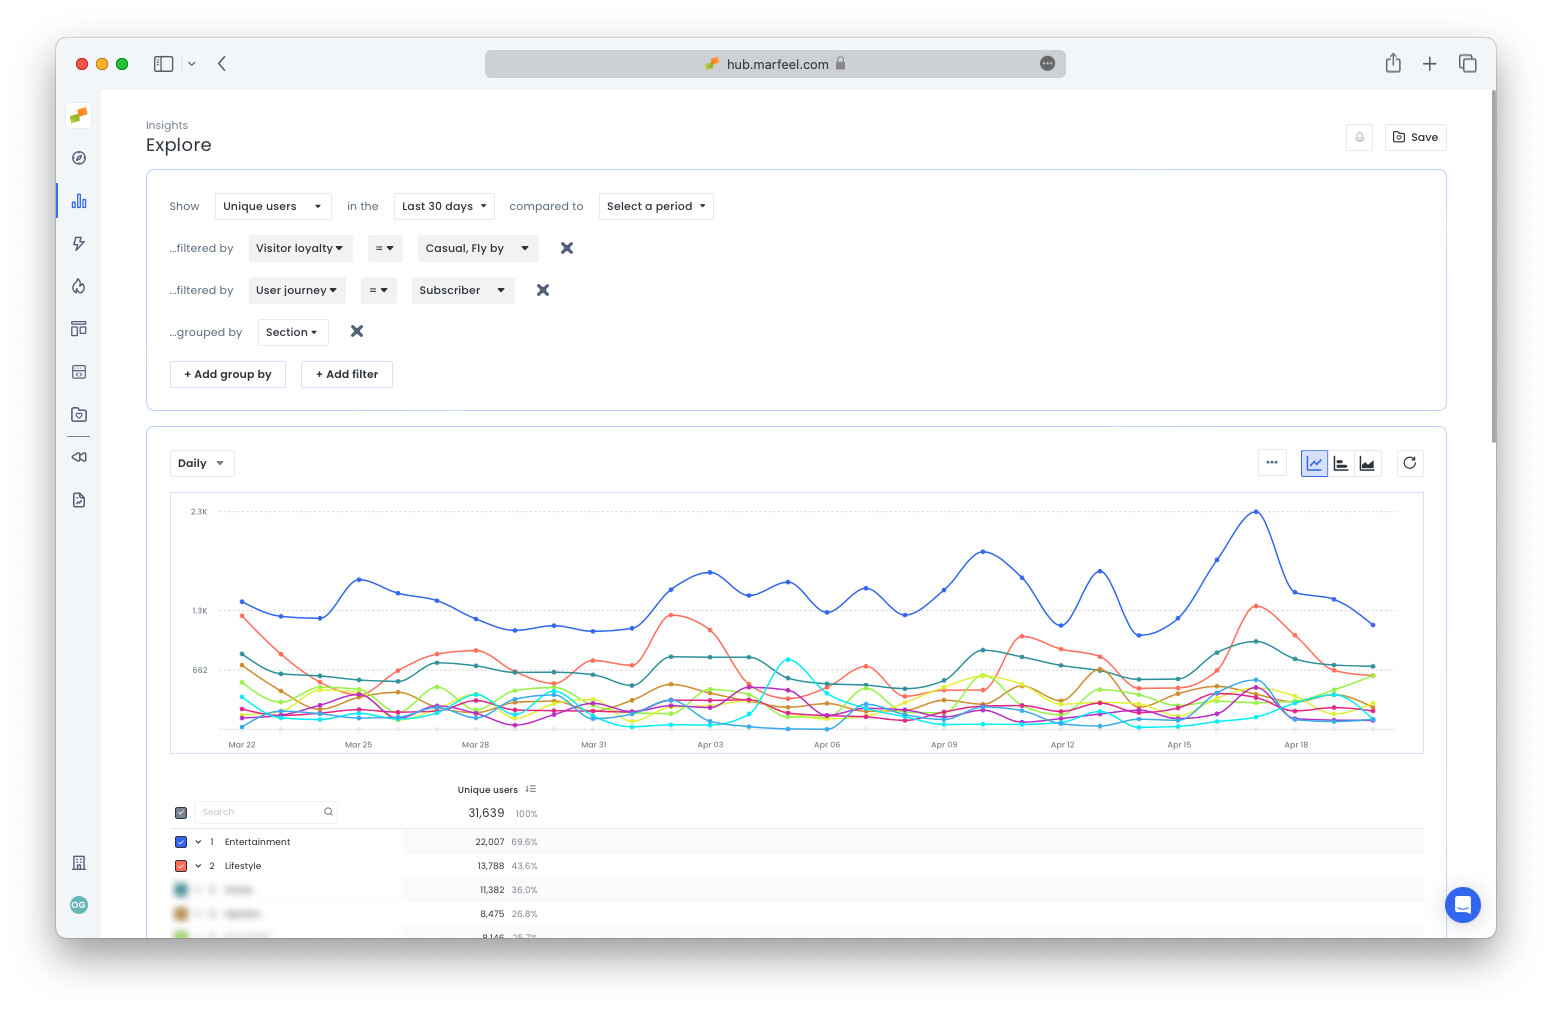
See it in Explore.
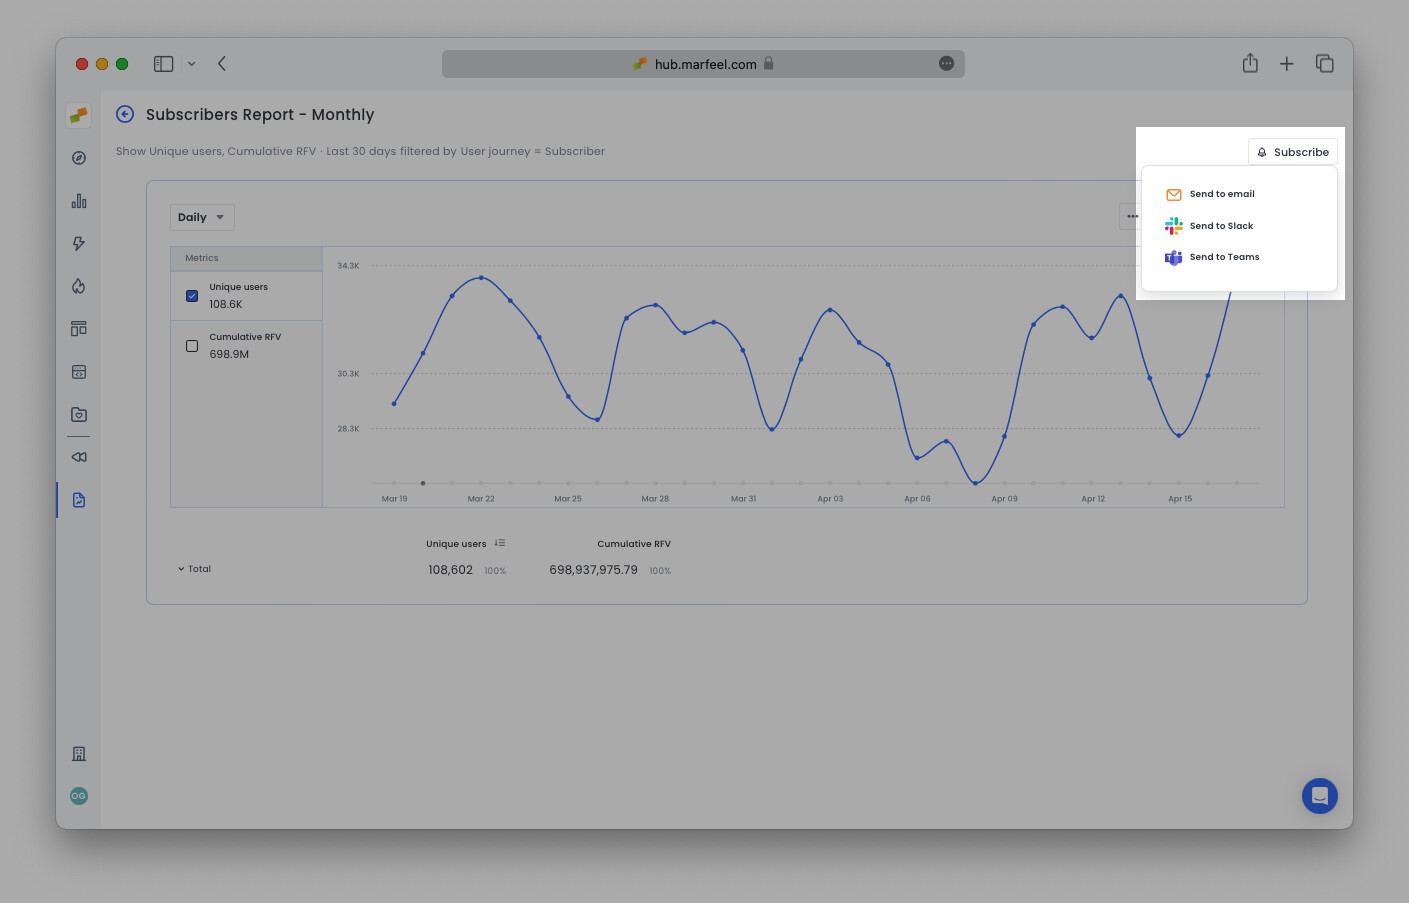
Save and share Explore reports
Section titled “Save and share Explore reports”Click the Save button in the top-right corner to save any Explore report to a workspace for future reference or share with team members. Once saved, you can Subscribe to receive the report in your inbox or a Slack or Microsoft Teams channel at regular intervals. This keeps the whole team aligned on conversion trends.
- Optimize your site and content for conversions
- View subscriptions in real time and user journeys in Compass
- Increase subscriptions with home page optimization using the Heads Up Display
How do I find out where my most loyal users come from?
In Explore, search for Unique users filtered by Visitor loyalty = Loyal, Lover and grouped by Traffic source with internal. This reveals whether your loyal audience arrives via Google, Direct, Google Discover, or internal navigation.
How can I identify subscribers at risk of churning?
Filter Unique users by Visitor loyalty = Casual, Fly by and User type = Subscriber, then group by Section. This shows which sections attract infrequent subscribers, helping you target re-engagement efforts.
Which sections should I target to convert loyal anonymous readers?
Search for Unique users filtered by Visitor loyalty = Loyal, Lover and User type = Anonymous, grouped by Section. The results show where your most engaged non-subscribers spend their time, so you can place conversion prompts in those sections.