
Conversions and attribution models explained
Marfeel enables publishers to set up trackable conversions, making it easy to measure how users take key actions on their site, such as subscribing. To provide deeper insights, Marfeel offers multiple attribution models that determine how credit for a conversion is distributed across touchpoints in the user journey. These models help publishers identify which content, channels, or interactions play the biggest role in driving business goals like subscriptions.
Attributed and non-attributed conversions
Section titled “Attributed and non-attributed conversions”Marfeel tracks two types of conversions: attributed and non-attributed.
Non-attributed conversions
Section titled “Non-attributed conversions”Non-attributed conversions are those for which Marfeel does not compute attribution data using the models described below. They are best used to track events such as button clicks, pop-up closes, or the user reaching a certain scroll depth in an article.
Attributed conversions
Section titled “Attributed conversions”Attributed conversions are those for which Marfeel computes attribution data using the models described below. They are best used to track revenue-generating actions such as subscriptions, where the preceding user journey is important for analysis and optimization purposes.
Conversion types
Section titled “Conversion types”Custom conversions
Section titled “Custom conversions”Marfeel allows publishers to configure custom conversions according to the needs of their business. Any action a user takes on your site can be set up as a conversion, such as becoming a subscriber, signing up for a newsletter, accepting push notifications, watching a video, or any other behavior that the publisher deems relevant. Visit our documentation to find out how to set up custom conversions.
Conversions by article
Section titled “Conversions by article”A measurement of the number of conversions per article you have published.
Conversions by user
Section titled “Conversions by user”A measurement of the number of conversions per user that visits your site.
Conversions by pageview
Section titled “Conversions by pageview”A measurement of the number of conversions per pageview that your site receives.
Attribution models
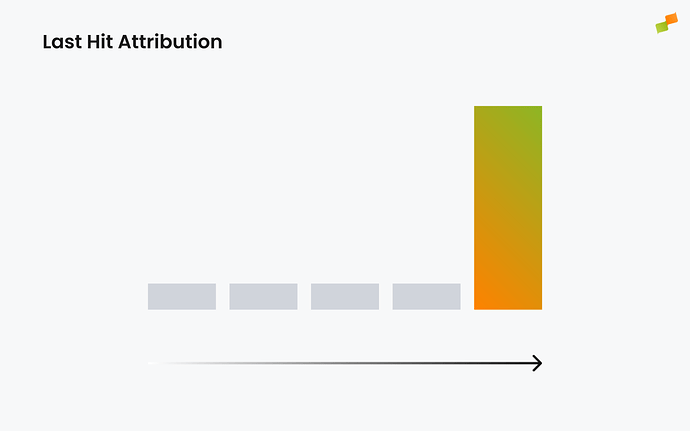
Section titled “Attribution models”Last Hit attribution model
Section titled “Last Hit attribution model”All credit for the conversion goes to the last page the user visited, the page from which the conversion took place.
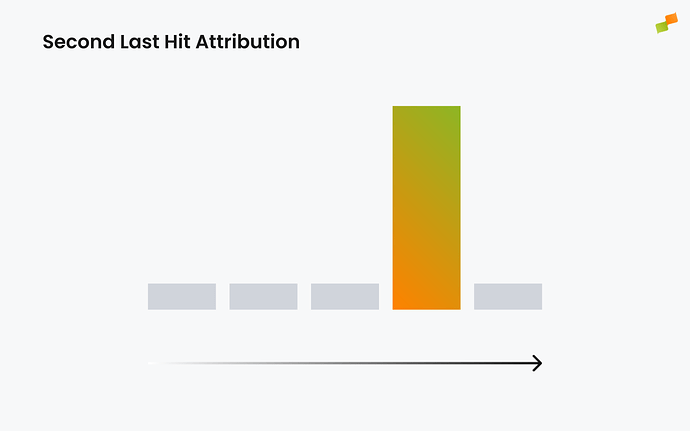
Second Last Hit attribution model
Section titled “Second Last Hit attribution model”All credit for the conversion goes to the page preceding the one from which the conversion took place. This is useful in scenarios where the conversion happens after a redirection.
For example, if the user’s journey is Article > Subscription page > Conversion, the conversion will be credited to the Editorial page.
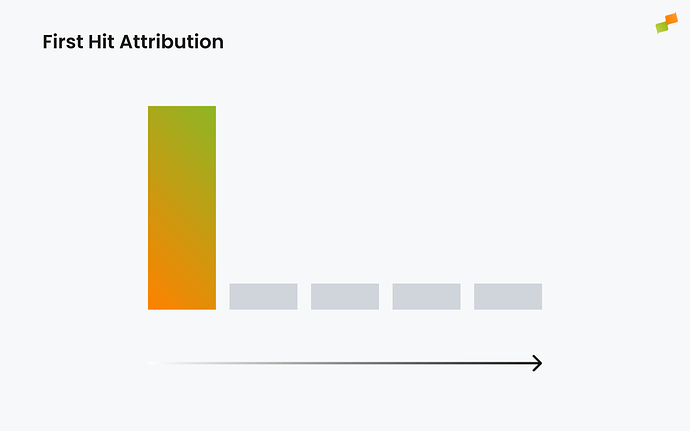
First Hit attribution model
Section titled “First Hit attribution model”All credit for the conversion goes to the first page viewed by the user in their journey. This model is useful for publishers evaluating top-of-funnel acquisition channels.
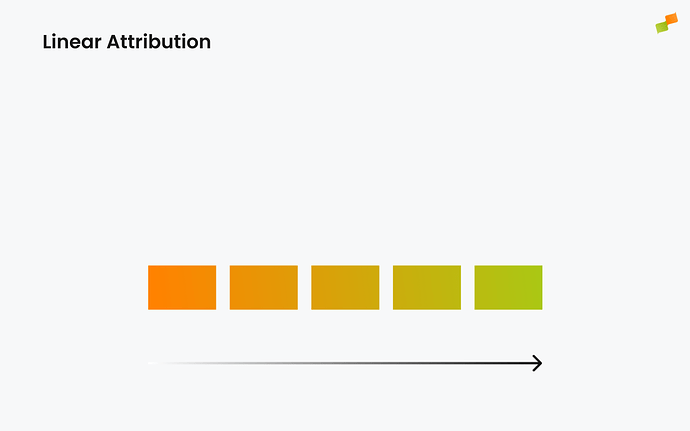
Linear attribution model
Section titled “Linear attribution model”Credit for the conversion is distributed equally across all pages in the user’s journey towards the conversion.
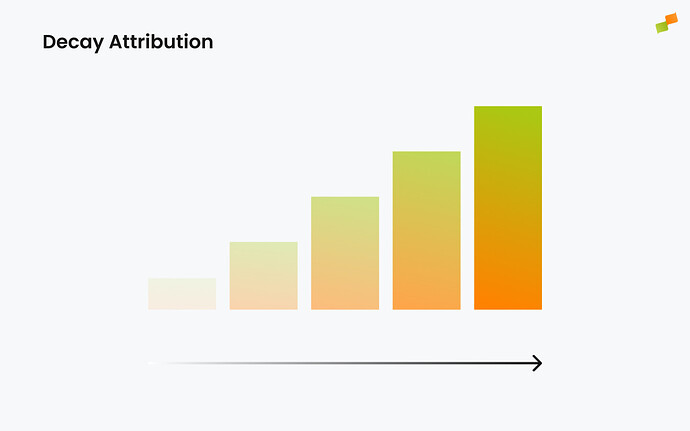
Decay attribution model
Section titled “Decay attribution model”Pages viewed closer to the end of the user’s journey receive more credit, using a 4-view half-life. This model helps identify which articles or sources directly generate conversions.
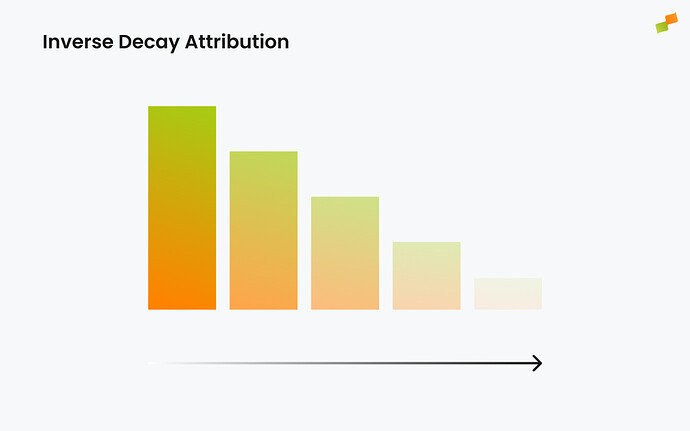
Inverse Decay attribution model
Section titled “Inverse Decay attribution model”Pages viewed at the beginning of the user’s journey receive more credit, using a 4-view half-life. This model helps identify content that acquires users who later convert.
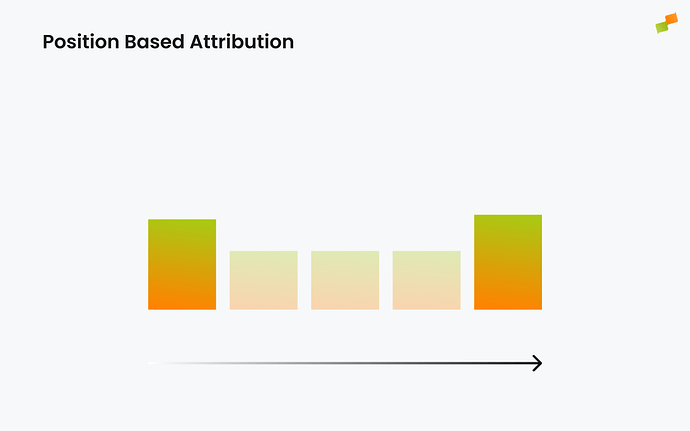
Position-based attribution model
Section titled “Position-based attribution model”40% of credit goes to both the first and last pages, with the remaining 20% spread equally across the other pages in the user’s journey.
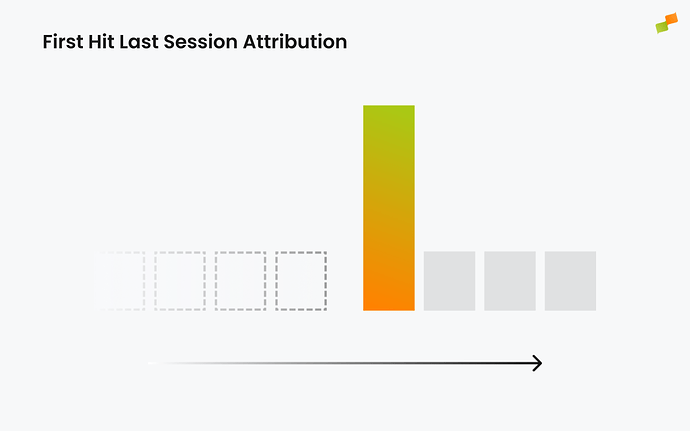
First Hit Last Session attribution model
Section titled “First Hit Last Session attribution model”All credit for the conversion goes to the first page viewed by the user in the last session, when the conversion took place. This model helps identify what initiated the session that resulted in a desired goal, such as becoming a subscriber: was it an email, an ad, Google Discover, or a specific type of content?
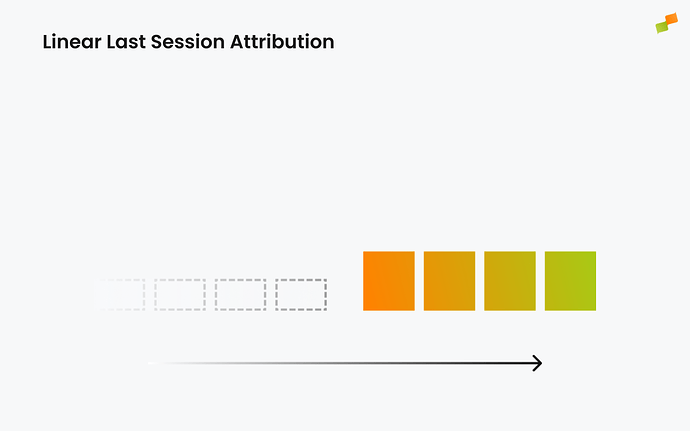
Linear Last Session attribution model
Section titled “Linear Last Session attribution model”Credit for the conversion is distributed equally across all pages visited by the user in the last session, when the conversion took place. This model reveals what content the user consumed in the session that preceded the conversion, which is important because conversions often come after periods of concentrated consumption and activity.
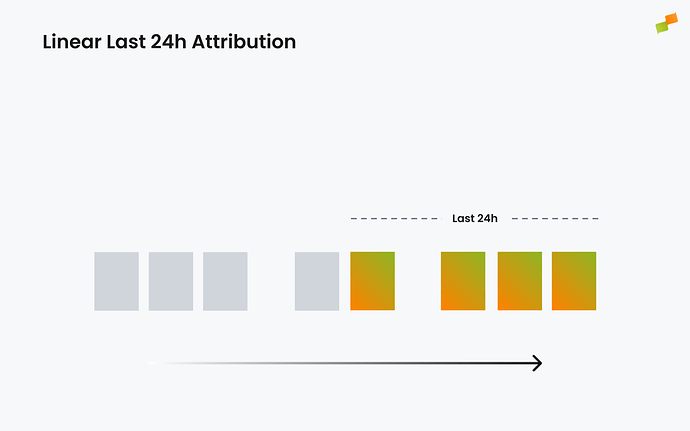
Linear Last 24h attribution model
Section titled “Linear Last 24h attribution model”Credit for the conversion is distributed equally across all pages visited by the user in the 24 hours preceding the conversion. This model reveals what content the user consumed in the period leading up to the conversion, which is important because conversions often follow periods of concentrated activity.
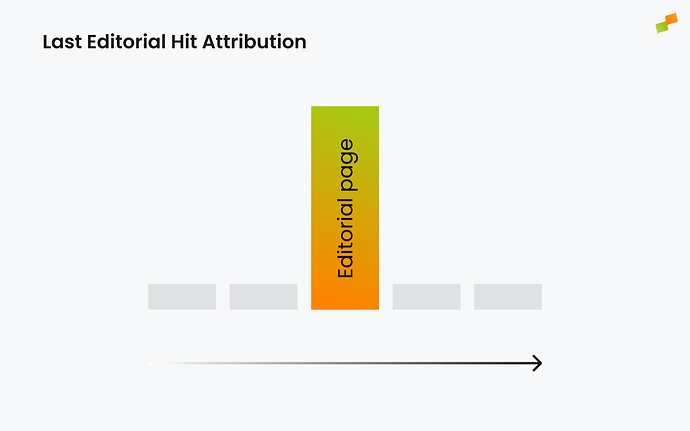
Last Editorial Hit attribution model
Section titled “Last Editorial Hit attribution model”All credit for the conversion goes to the last viewed page with publish time. This model focuses specifically on editorial content, filtering out non-article pages from the attribution.
To view a comprehensive list of all of Marfeel’s Metrics and Dimensions, visit our Glossary.
What is the difference between attributed and non-attributed conversions?
Non-attributed conversions track simple events like button clicks or scroll depth without computing attribution data. Attributed conversions track revenue-generating actions like subscriptions and include full attribution data showing which pages in the user journey contributed to the conversion.
Which attribution model should I use to identify top-of-funnel content?
Use the First Hit attribution model, which gives all credit to the first page viewed in the user journey. This helps publishers evaluate which acquisition channels and content pieces bring users into the funnel.
How does the Position-based attribution model distribute credit?
The Position-based model gives 40% of credit to both the first and last pages in the user journey, with the remaining 20% spread equally across all pages in between.