
Recirculation Metrics & Dimensions
Recirculation metrics measure how effectively your site content drives internal traffic. Marfeel captures and processes recirculation data across links and modules, giving you visibility into how users discover and engage with additional content on your site.
Link-based Metrics
Section titled “Link-based Metrics”Link-based metrics track how often links or modules are available, seen, interacted with, and clicked. These metrics apply to all recirculation links, regardless of the module in which they appear.
Eligible
Section titled “Eligible”Total count of links a user could potentially view or interact with.
A link is considered eligible when it is present on the page and could be reached by the user through scrolling or interaction.
For Flowcards, it counts how many times a Flowcard is prepared to be shown, before its trigger is met.
Viewable
Section titled “Viewable”Number of times a link actually appears in the user’s viewport (the user scrolls enough to see it).
For Flowcards, it counts how many times a Flowcard is showed in its initial state, once its first trigger has been met.
Clicks or taps on links, reflecting successful recirculation to another internal page.
For Flowcards, it shows how many times users expand a Flowcard.
Viewability Rate
Section titled “Viewability Rate”Calculated as Viewable / Eligible, measuring how often an eligible link becomes visible to the user.
For Flowcards, it measures how often an eligible Flowcard becomes shown to the user.
Open Rate
Section titled “Open Rate”Calculated as Open / Viewable, this metric measures clicks on a link divided by the number of times it is shown on screen.
For Flowcards, it indicates the proportion of visible Flowcards that users choose to expand.
Also known as Viewable CTR, Open Rate makes it possible to compare apples to apples. A link in the footer of the home page and one linking to the top headline have very different exposure levels. A link might have relatively few clicks in absolute numbers but still outperform other links in terms of Open Rate or Viewable CTR.
Track Viewable CTR using the Heads Up Display or by selecting an article in Compass under link performance (see how).
Module-based Metrics
Section titled “Module-based Metrics”Module-based metrics aggregate recirculation performance at the module level, independently of individual links. These metrics should not be used in combination with any Destination based dimension, or Module Position one.
Module Eligible
Section titled “Module Eligible”Counts how many times a module was eligible to be seen by users.
Module Viewable
Section titled “Module Viewable”Counts how many times a module became visible in the viewport.
Module Viewability Rate
Section titled “Module Viewability Rate”Calculated as Module Viewable / Module Eligible, measures how often eligible modules are actually seen.
Module Open Rate
Section titled “Module Open Rate”Calculated as Open / Module Viewable, measures the number of clicks on any link within a module divided by the number of times that the module is shown on screen.
Flowcard-based Metrics
Section titled “Flowcard-based Metrics”The following metrics apply exclusively to Flowcards.
Conversion
Section titled “Conversion”Clicks on links inside an opened Flowcard, reflecting deeper engagement with recommended content.
Conversion Rate
Section titled “Conversion Rate”Calculated as Conversion / Open, showing the proportion of Flowcard opens that lead to further clicks inside the Flowcard.
Eligible Conversion Rate
Section titled “Eligible Conversion Rate”Calculated as Conversion / Eligible, revealing the percentage of all eligible Flowcards that generated at least one click on internal links.
Viewable Conversion Rate
Section titled “Viewable Conversion Rate”Calculated as Conversion / Viewable, indicating how effectively visible Flowcards convert into additional clicks.
Flowcard Snap-point Metrics
Section titled “Flowcard Snap-point Metrics”These metrics describe interaction states specific to Flowcards:
Minimized
Section titled “Minimized”The Flowcard is reduced but still present on screen
Hidden
Section titled “Hidden”The Flowcard is dismissed
Promoted
Section titled “Promoted”The Flowcard is actively emphasized to the user
Average RFV metrics
Section titled “Average RFV metrics”Average RFV metrics let you compare the average user that interacts with a link or a Flowcard. The higher the score, the more engaged the average user.
Avg. RFV Viewable
Section titled “Avg. RFV Viewable”Average RFV of the users who saw a link or were shown a Flowcard.
Avg. RFV Open
Section titled “Avg. RFV Open”Average RFV of the users who clicked or tapped on a link, or opened a Flowcard.
Avg. RFV Conversion
Section titled “Avg. RFV Conversion”Average RFV of the users who clicked on a link inside a Flowcard.
Dimensions
Section titled “Dimensions”Module Name
Section titled “Module Name”All recirculation data is grouped within modules. Each module is a visual component containing links, like a Most read sidebar, the opening of the Homepage, or a promotion banner. Every module that contains links can be tagged with a name, and then the recirculation metrics for the links inside can be analyzed using Module Name dimension.
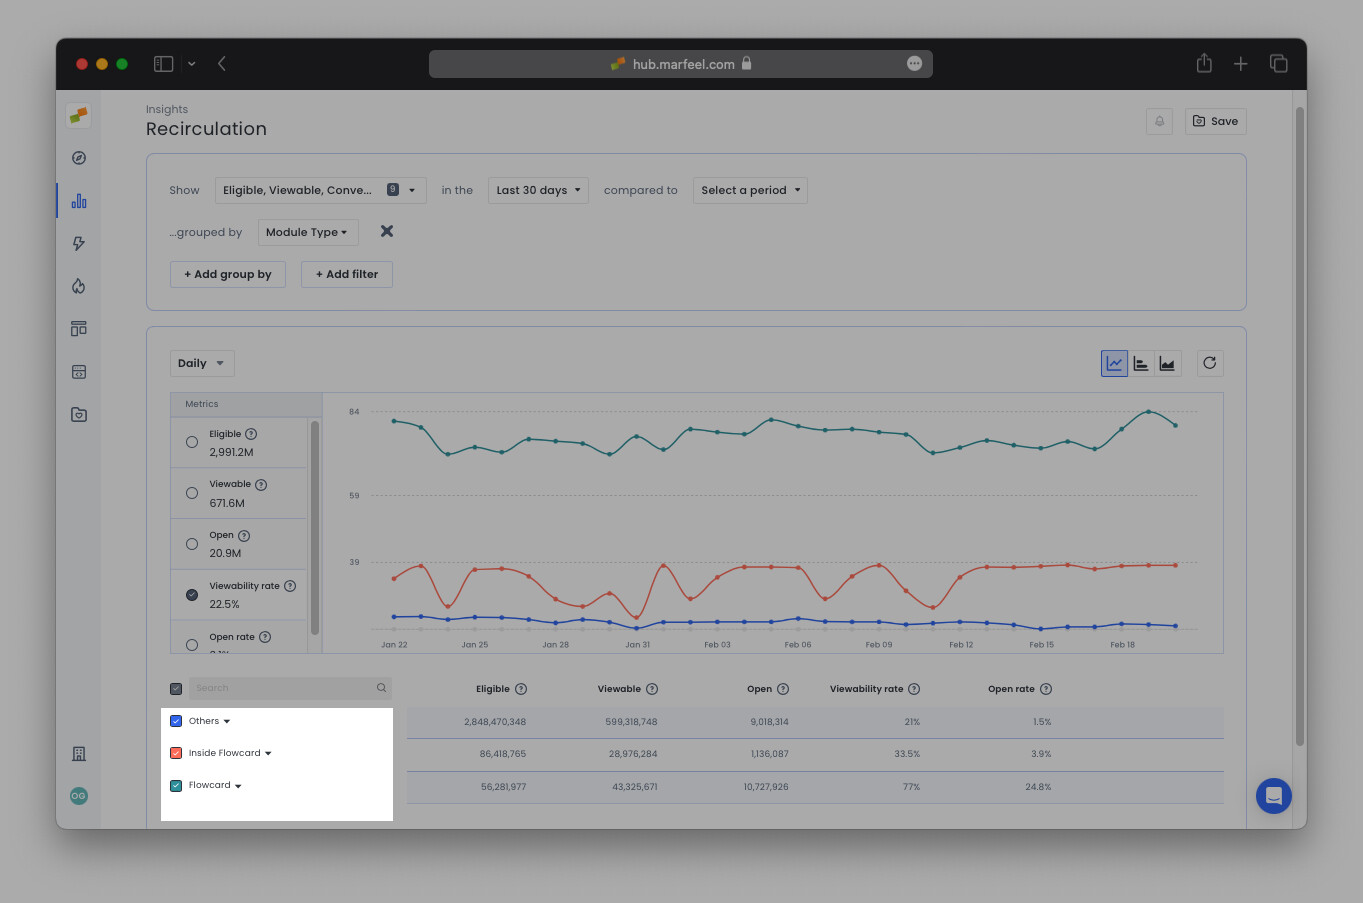
Module Type
Section titled “Module Type”Recirculation data is grouped by module type:
- Flowcards Expandable experiences triggered after a user scrolls a certain percentage of the page.
- Inside Flowcards Links displayed inside an opened Flowcard.
- Inline Marfeel experiences embedded directly within content, displayed inline or as popups.
- Others Any other tagged region of a webpage (for example, homepage sections or opening modules).
Module Position
Section titled “Module Position”Indicates the position of a link within a module, starting from 0.
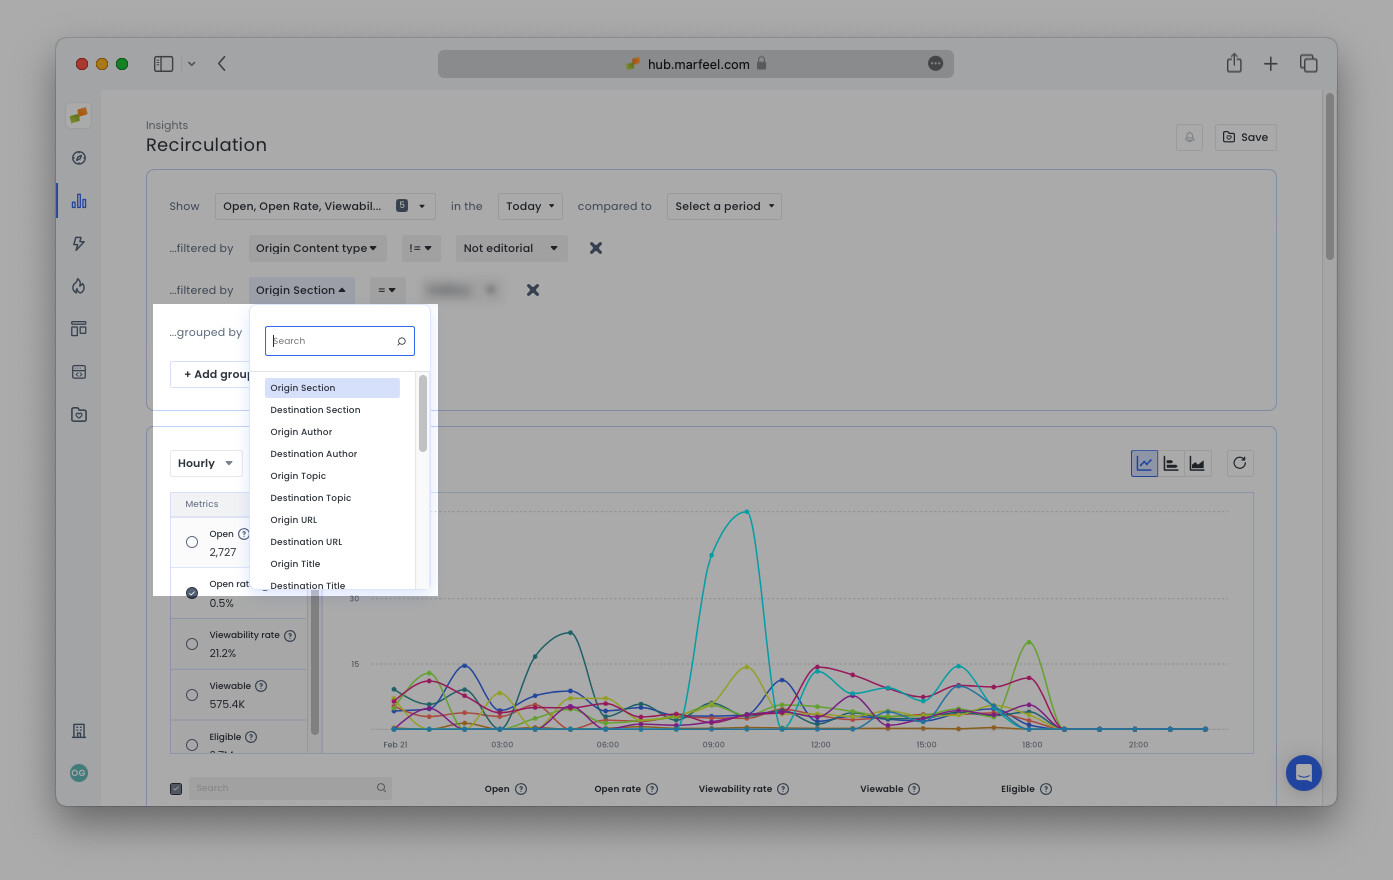
Origin vs Destination
Section titled “Origin vs Destination”Internal traffic always involves two sides: where the user started (the origin) and where the user recirculated to (the destination).
The Recirculation Insights module allows you to filter and group by the same dimensions you are accustomed to seeing through the platform: URL, Title, Host, Author, Section, Topic, Tag, Tag Group, and Content Type, further delineated as either Origin or Destination. For a detailed breakdown of module performance, see the Recirculation Insights report.
Device Type
Section titled “Device Type”Mobile, Desktop, or Tablet.
Page Technology
Section titled “Page Technology”Recirculation only works natively for Web, but Flowcards can run on AMP, and Inside Flowcard metrics come from Flowcards Page Technology. Custom implementations can obtain recirculation metrics from different Page Technologies, too.
User Journey
Section titled “User Journey”Segments users based on their relationship with the site: Anonymous, Registered, Subscriber, or custom ones.
Audience Loyalty
Section titled “Audience Loyalty”Marfeel’s funnel-based segmentation derived from RFV: New, Fly By, Casual, Loyal, Lover, Private, and Won Back.
Traffic Medium
Section titled “Traffic Medium”Describes how the user arrived at the site (direct, search, social, referral, among others).
Test Version
Section titled “Test Version”Used in A/B tests for recommender experiences. Separates control from variant recirculation metrics.
To view a comprehensive list of all of Marfeel’s Metrics and Dimensions, visit our Glossary.
What is the difference between Eligible and Viewable in recirculation metrics?
Eligible counts all links a user could potentially reach through scrolling or interaction. Viewable counts the links that actually appeared in the user’s viewport. The ratio between them is the Viewability Rate.
How is Open Rate calculated for recirculation links?
Open Rate is calculated as Open divided by Viewable. Also known as Viewable CTR, it measures clicks on a link relative to the number of times it appeared on screen, allowing fair comparison between links in different positions.
What metrics are exclusive to Flowcards?
Flowcards have exclusive conversion metrics: Conversion (clicks inside an opened Flowcard), Conversion Rate (Conversion divided by Open), Eligible Conversion Rate (Conversion divided by Eligible), and Viewable Conversion Rate (Conversion divided by Viewable). Flowcards also track snap-point states: Minimized, Hidden, and Promoted.