
Workspaces and dashboards for publisher analytics
Workspaces are folders where you save your reports from any part of the Marfeel platform and turn them into dashboards that aggregate your chosen metrics and KPIs into data visualizations.
When you create specific queries and filter configurations in your analytics, you will want to access them again later. Workspaces make that easy, keeping every saved report one click away.
The value of workspaces
Section titled “The value of workspaces”Every modern publisher should aspire to create a data culture and install robust processes across the business that support it.
Workspaces enable this by allowing you to define how your data should be seen by different teams and stakeholders in the organization, enforcing a standardized vision for everyone.
This results in:
-
Time savings: Keeping frequently used reports one click away avoids regenerating the same report over and over, making it easier to access the specific configurations of filters, dimensions, and metrics that matter to your business.
-
Improved organization: Categorizing reports according to team, function, or any other system you choose makes it easier for different stakeholders to carry out their work. You can also organize your private reports to enhance your personal workflow.
-
Stronger alignment: Workspaces can be shared with other users to improve collaboration, discussion, and decision-making, ensuring that different stakeholders and teams are looking at the same data for more consistent and accurate analysis.
-
Consistency: Create routines by scheduling reports on a daily, weekly, or monthly basis. Subscriptions ensure that everyone has access to up-to-date information at regular intervals without checking manually.
🎓 Master dashboards, step by step 📊 The video below is an excerpt from the Dashboards Fundamentals course.
🧠 Discover more learning paths on Marfeel Academy.
Workspaces features
Section titled “Workspaces features”Workspaces are highly flexible, with many configuration and setup options to suit the needs of the different teams and stakeholders in your business.
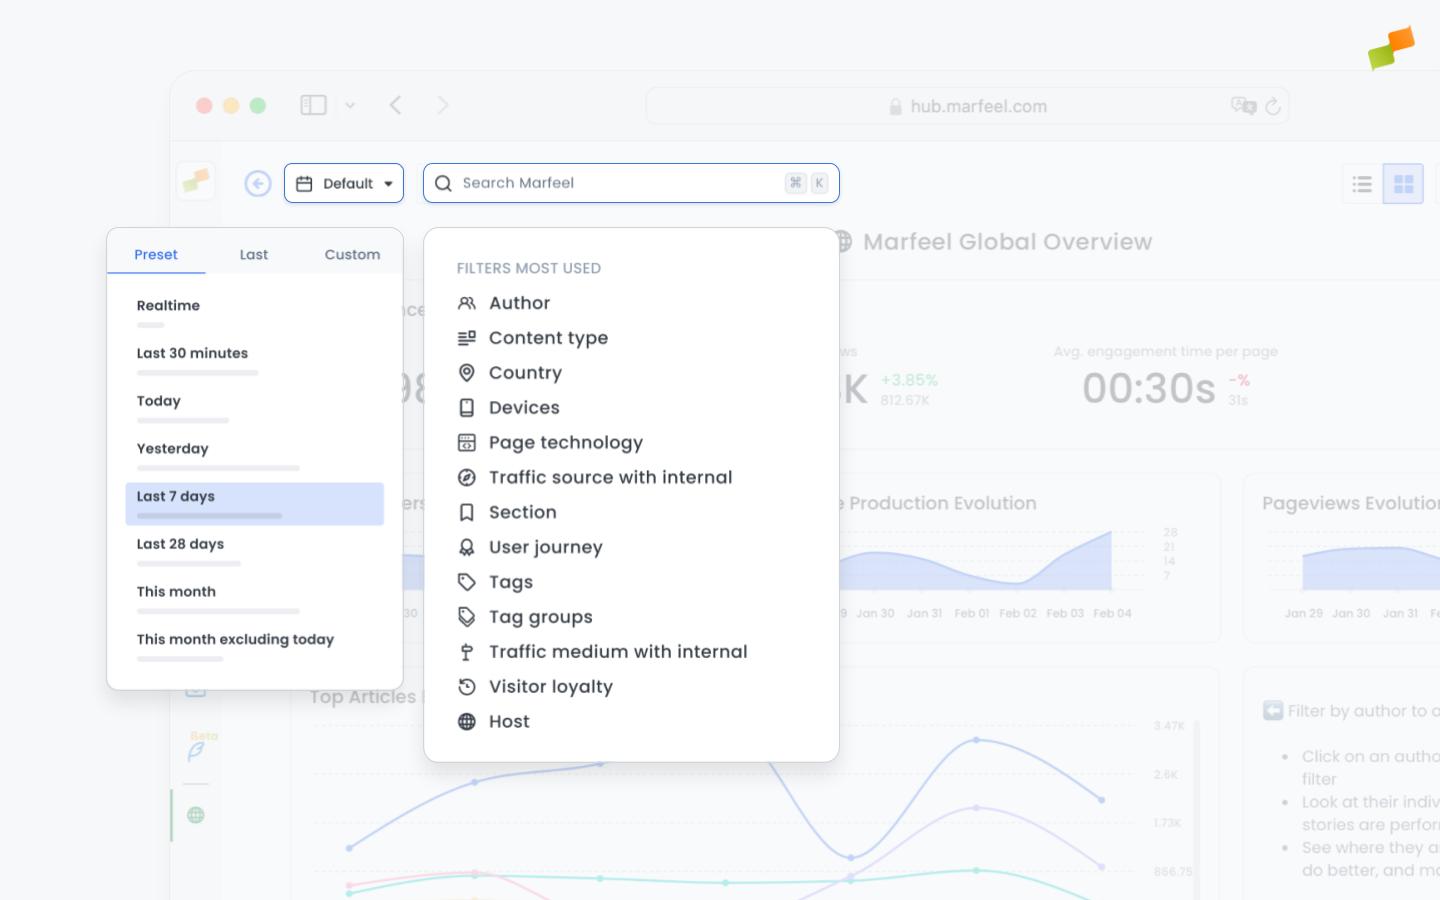
- Dynamic time frame: Dashboards present live data, not frozen snapshots. Choose any timeframe and all your charts and graphs update automatically.
- Dynamic filtering: Apply filters at the top level and all of your data updates in concert.
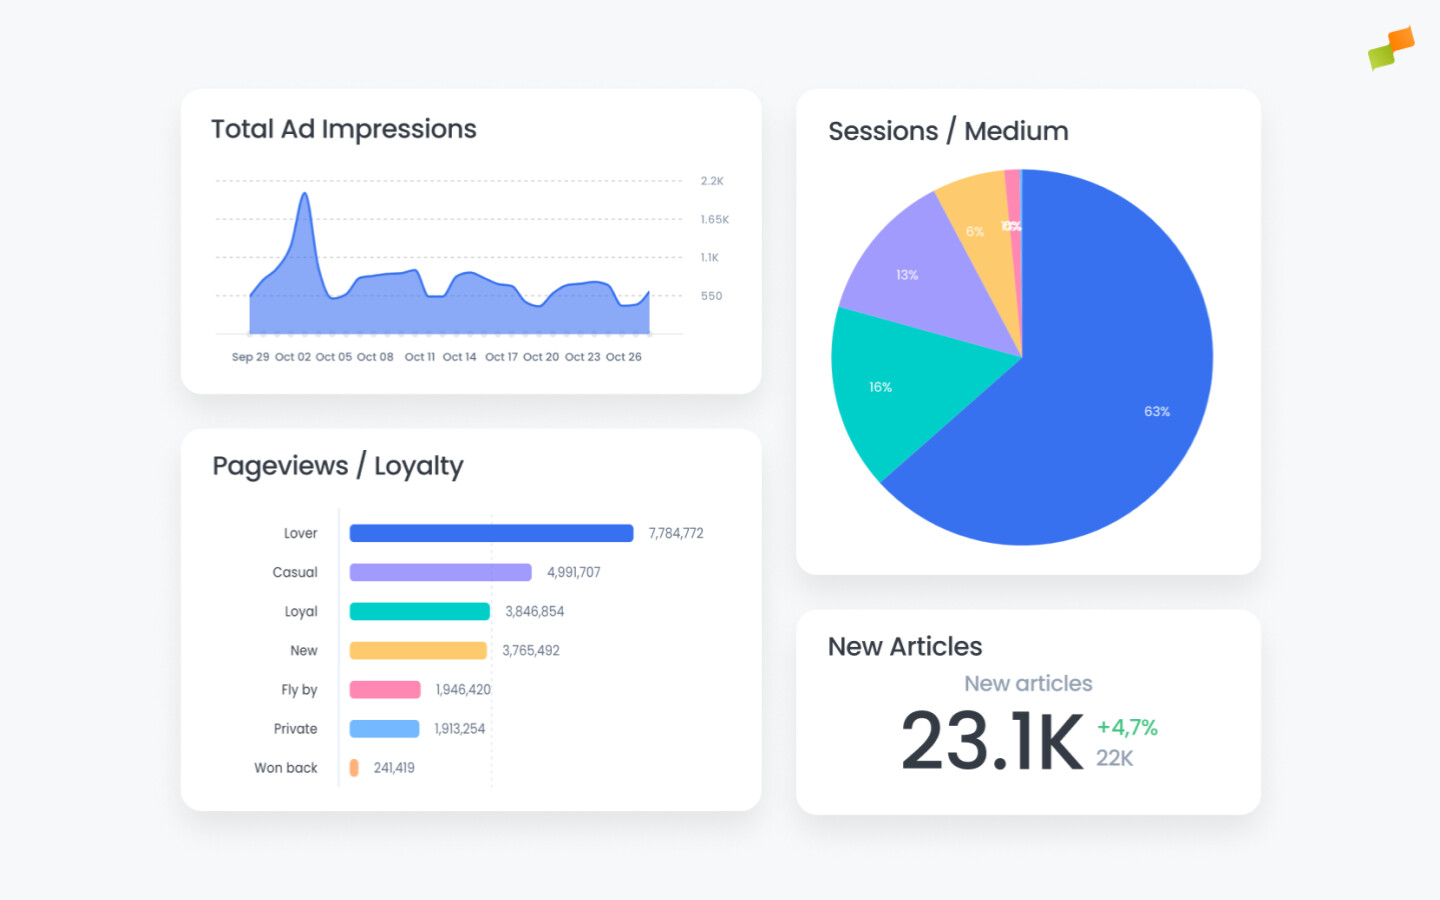
- Multiple visualization types: Choose from time series, area graphs, bar charts, pie charts, funnel graphs, simple charts, and article lists for editorial context.
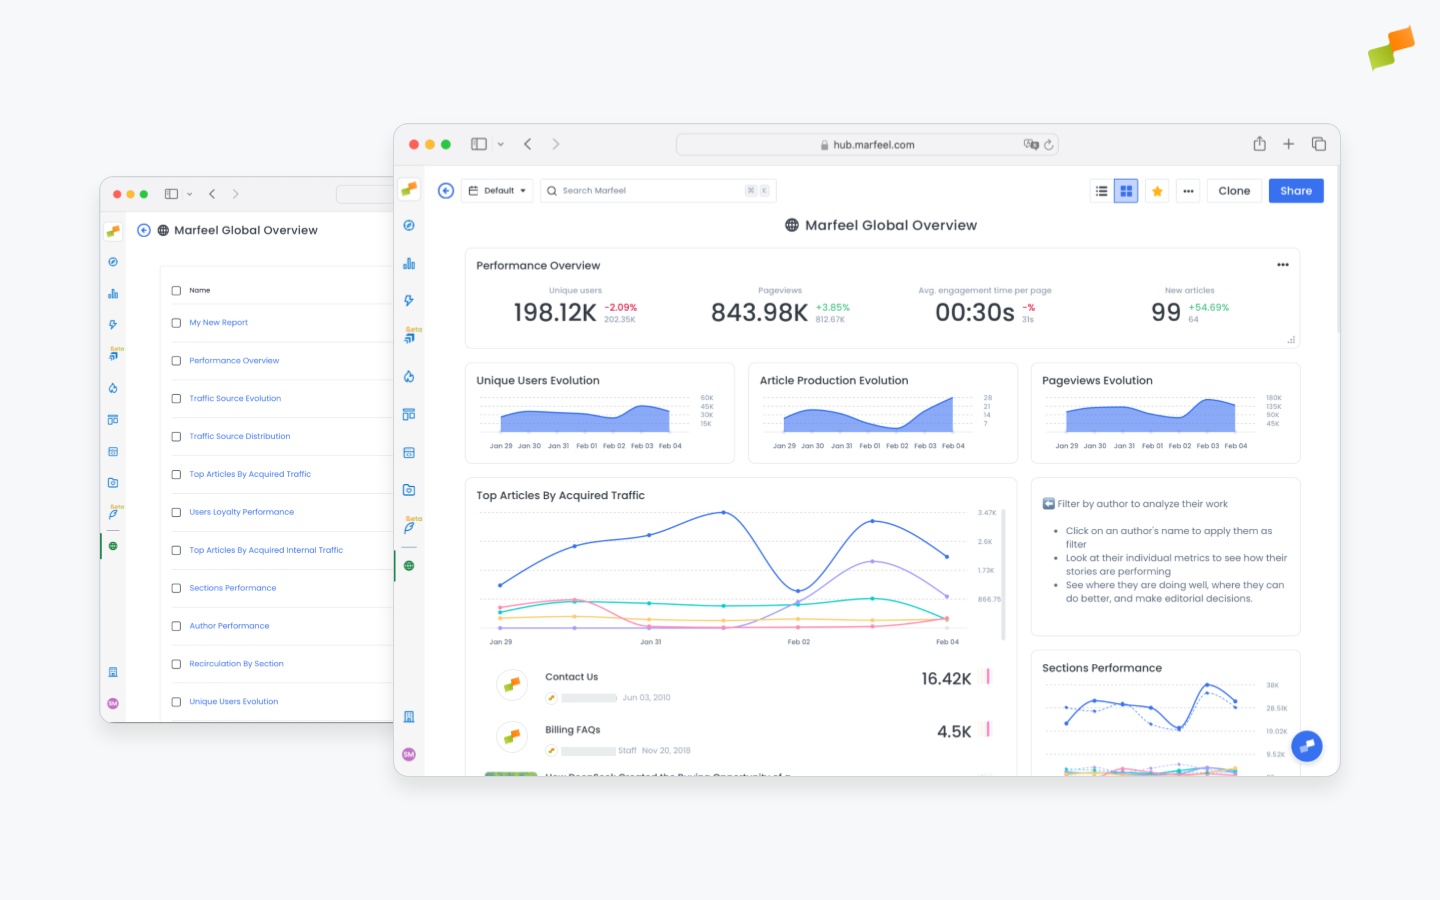
- View modes: Workspaces have two view modes:
List modeandDashboard mode. Switch between them in a single click through the top right menu. - Text widget for explanations: Text cards with instructions, explanations, and contextual information help your colleagues understand what they are looking at and how to use it.
- Bookmarking: Favorite and pin your top workspaces to the sidebar for easy access with a single click from anywhere in Marfeel.
- Sharing: Workspaces and dashboards can be shared to build alignment and get everyone on the same page by working with the same data and the same frame of analysis. Choose whether users will be able to further explore the exposed report with filtering capabilities, or whether you want to offer a closed report.
Our dedicated page on Workspace Management provides details on workspace configuration.
Our dedicated page on Dashboard Management goes in depth on how to use all these options to get the most out of your dashboards.
What are workspaces in Marfeel?
Workspaces are folders where you save reports from any part of the Marfeel platform and turn them into dashboards that aggregate your chosen metrics and KPIs into data visualizations.
Can I share workspaces with other team members?
Yes. Workspaces can be shared with other users to improve collaboration, discussion, and decision-making, ensuring that different stakeholders and teams are looking at the same data for consistent analysis.
What visualization types are available in Marfeel dashboards?
Marfeel dashboards offer time series, area graphs, bar charts, pie charts, funnel graphs, simple charts, and article lists for editorial context.